Optimization of variables is needed to solve any equation in mathematics. Excel has some tricks for solving equations with less time consumption. The Goal Seek and formulas are some tricks to solve equations in Excel. But they cannot optimize the variables. Excel Solver is a good solution in this case. In this article, we will discuss how to optimize multiple variables using Solver in Excel with proper illustrations.
How to Optimize Multiple Variables in Excel: Step-by-Step
In this article, we will use the Excel Solver to optimize multiple variables. Assume that a company produces the TV and refrigerators. Now, we will use the Solver to get the maximum profit by optimizing the number of TV and refrigerator production based on some constraints. The number of TV and refrigerator are the variables. We will describe all the things in the below section.
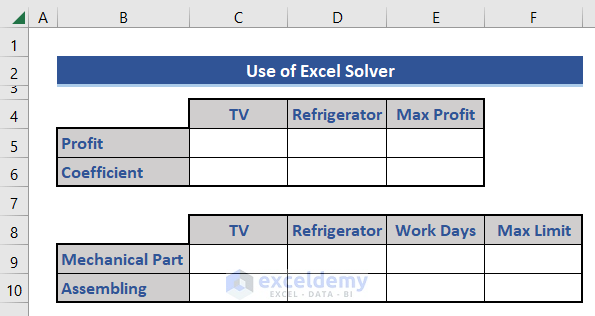
📌 Step 1 of 5: Design Dataset and Input Data
- First, we design the dataset to insert all the data.
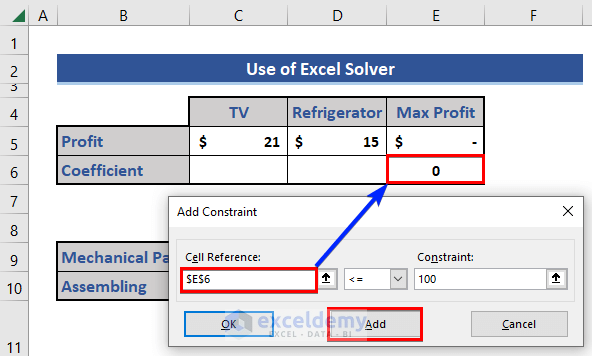
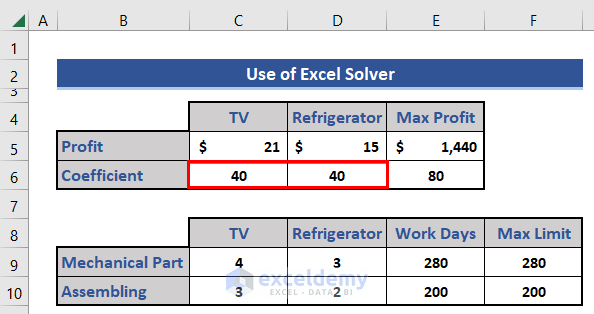
- The profit after selling each TV, and refrigerator are $21 and $15 respectively. The production of TV and refrigerator has two sections: mechanical, and assembling. We input that information into the dataset.
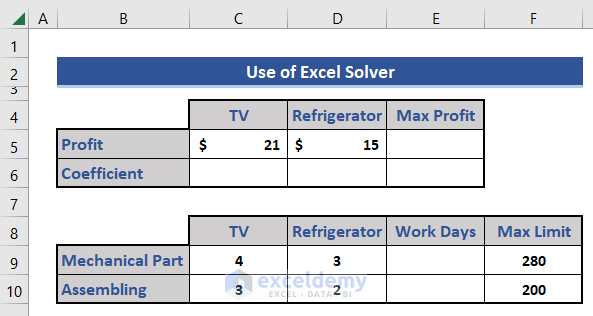
The coefficients are the variables that we need to optimize here.
📌 Step 2 of 5: Insert Equations Using Formula
- Now, go to Cell E5 to calculate the maximum profit using the following formula.
=SUMPRODUCT(C5:D5,$C$6:$D$6)
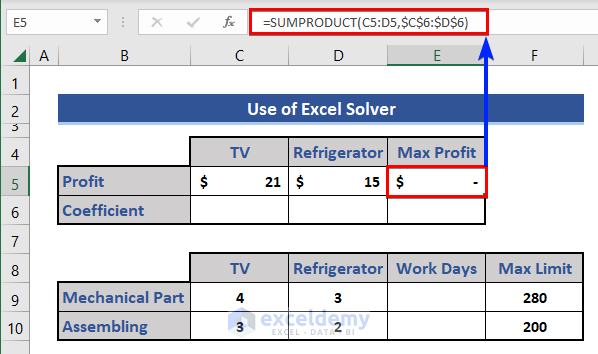
Here, C5, and D5 indicate the profit for 1 item each. And C6, D6 are the coefficients of TV and refrigerator. Those are the variables of this problem. We have to optimize the value of those two variables.
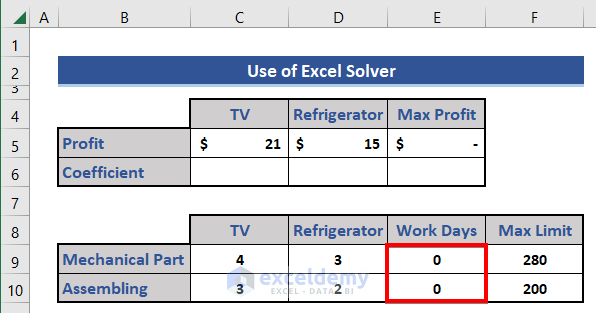
- Again, apply the similar SUMPRODUCT formula on Cells E9 and E10. Those will calculate the total production workdays.
For Cell E9:
=SUMPRODUCT($C$6:$D$6,C9:D9)
For Cell E10:
=SUMPRODUCT($C$6:$D$6,C10:D10)
- Now, put a SUM formula on Cell E6.
=SUM($C$6:$D$6)
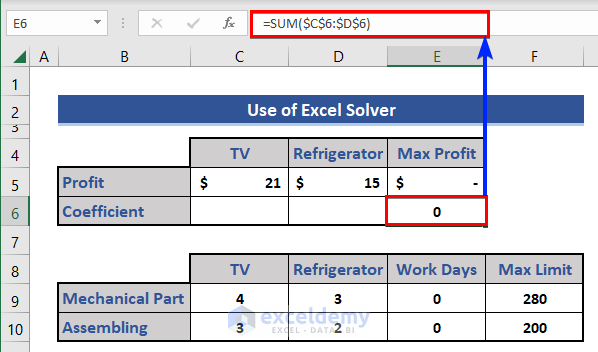
This calculates the total production quantity. We have a restriction that the maximum production quantity will not exceed 100.
📌 Step 3 of 5: Enable Solver in Excel
- Now, we will enable the Solver.
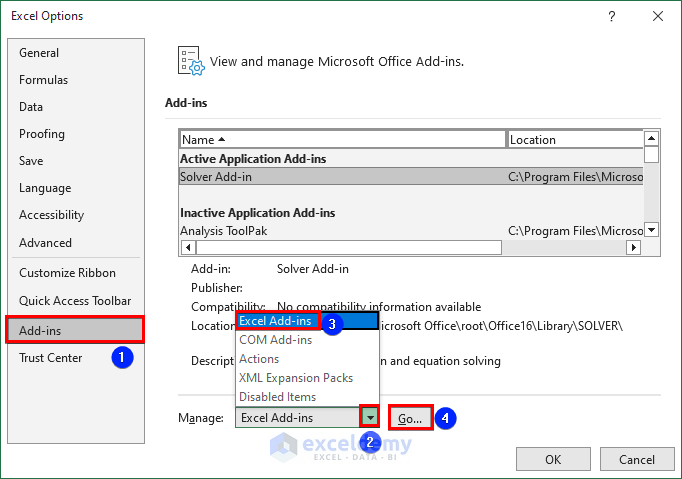
- Go to File>> Options.
- Choose the Add-ins option from the right section.
- Click on the down arrow of the Manage section.
- Choose the Excel Add-ins option.
- After that, click on the Go button.
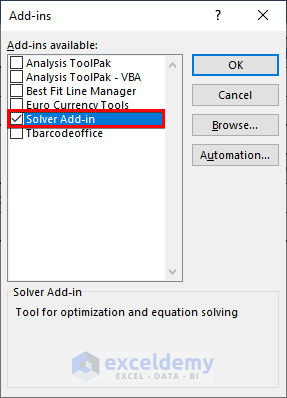
- Mark the Solver Add-in from the Add-ins window and press the OK button.
- Now, go to the Data tab.
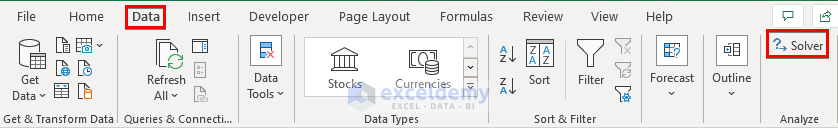
- We can see the Solver add-in is available here.
- The Solver Parameters window appears.

We will set different cell references in this window.
📌 Step 4 of 5: Input Solver Parameters for Optimization
- Choose Cell E5, which will determine the maximum profit as the objective.
- Then, mark the Max option.
- Select Range C6:D6 as the variables.
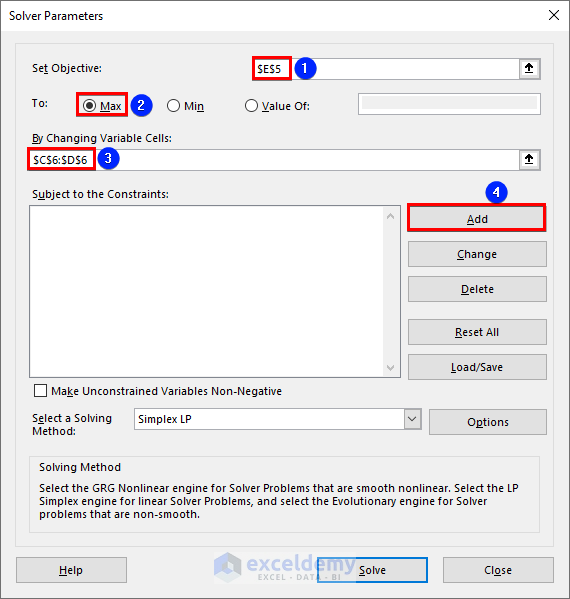
There are more options to add constraints. For that click on the Add button.
- The Add Constraints window appears.
- Choose the Cell Reference from the dataset.
- Then, set the symbol and the value of the constraint.
If we have more than one variable, click on the add button and the constraints one by one. Finally, press the OK button.
- We can see all the constraints are added in the window.
- Unmark the Make Unconstrained Variables Non-Negative and choose Simplex LP as the method.
- Finally, click on the Solve button.
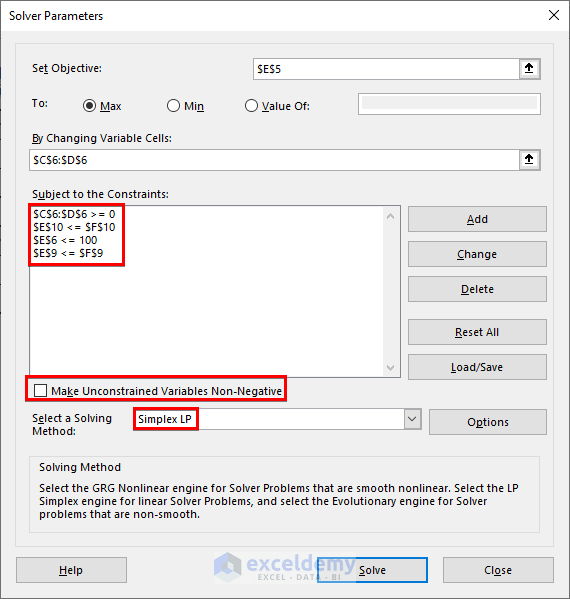
Here, we set four constraints. The sum of products equal to or less than 100, coefficients must be greater than 0, total workdays for the mechanical part is equal to or less than 280 and assembling is 200.
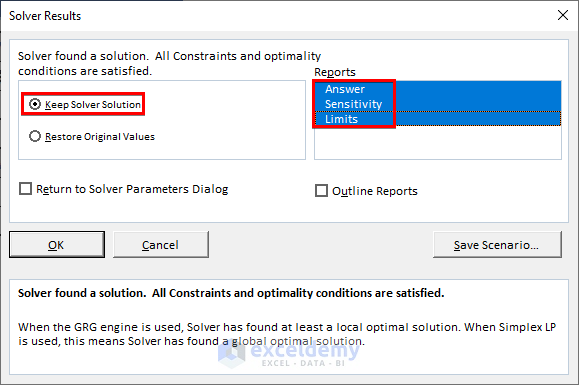
- The Solver Results window appears.
- Mark the Keep Solver Solution option.
- Then, choose the Answer, Sensitivity, and Limits options from the Reports section.
- Finally, press the OK button.
- Look at the dataset.
We can see the coefficients are changed after optimization. There are also three reports created.
📌 Step 5 of 5: Analyse Reports of the Solver
- Look at the Answer Report.
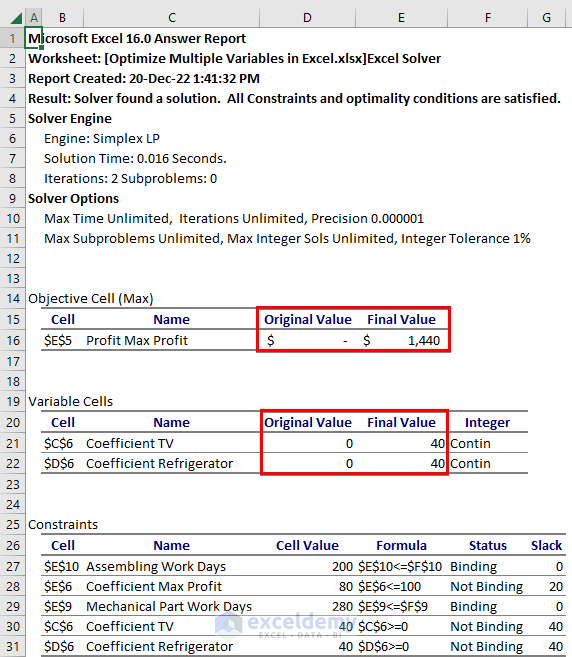
We can see the initial value of the max profit was 0, and the final value of 1440. For variables, initially, that was 0, and finally 40 for each TV and refrigerator.
- Again, look at the Sensitivity Report.
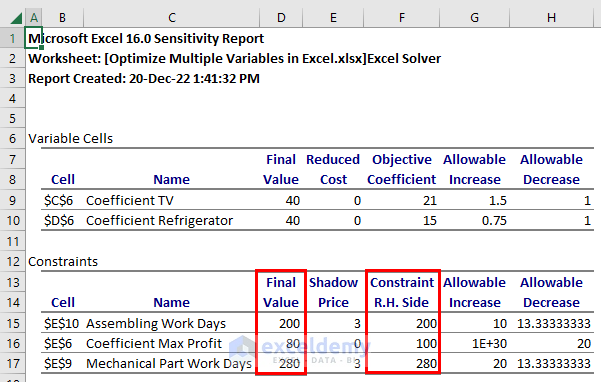
We can see workdays of mechanical and assembling are the value as we set the constraints. But the total number of productions was set equal to or less than 100, and we get that 80 after optimization.
- Finally, we have the Limits Report.
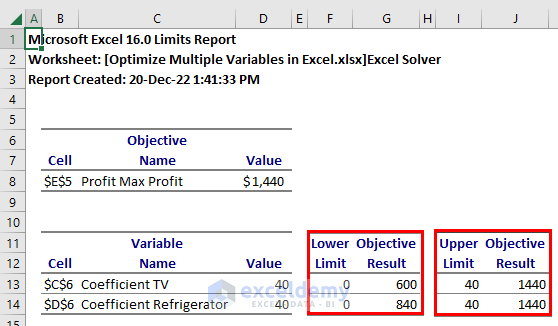
The lower limit for TV and refrigerator set to 0, and after optimization, we get this as 40 for both. If we change the constraints those values will also change similarly.
In this way, we can optimize multiple variables in Excel with Solver.
Read More: How to Solve Linear Optimization Model in Excel
Download Practice Workbook
Download this practice workbook to exercise while you are reading this article.
Conclusion
In this article, we have described how to optimize the multiple variables in Excel with Solver. If you need only solution without optimization, you can use the Goal Seek feature and customize the formula. I hope this will satisfy your needs.
Related Articles
- How to Make Price Optimization Models in Excel
- Excel Optimization with Constraints
- How to Solve Network Optimization Model in Excel
- How to Perform Route Optimization in Excel
- Schedule Optimization in Excel
- How to Perform Multi-Objective Optimization with Excel Solver
- How to Calculate Optimal Product Mix in Excel
- Mean Variance Optimization in Excel
<< Go Back to Optimization in Excel | Solver in Excel | Learn Excel

