In this blog post, we’ll delve into the Excel world of stocks and examine some of the valuable features found in the Stocks ribbon, which is located under the Data tab. Excel allows users to stay up to date with the most recent market information by allowing them to update stocks in Excel and retrieve real-time quotes.
Excel proves to be an invaluable resource for investors and traders when it comes to tracking and analyzing stocks. Learn how to take advantage of these features to efficiently manage, track, and analyze your stock portfolio. After reading the “Stocks in Excel” topic, get ready to maximize Excel’s capabilities.
Download Practice Workbook
You can download the practice workbook from the following download button.
How to Get Stocks Value in Excel
To obtain a stock quote without relying on an Excel add-in, you can utilize a feature available in Office365. The following steps are part of the process:
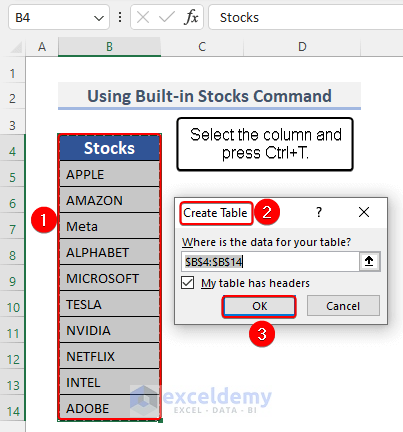
- You won’t get any headings if you don’t create a table before using Add Column. This can be avoided by entering your data into an Excel table (Ctrl + T), in which case the formulas will be carried down with Header automatically.
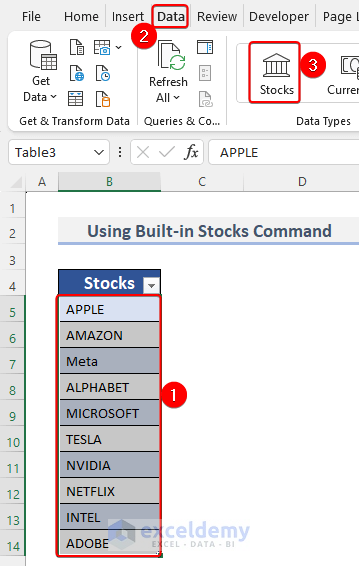
- Select a column (e.g., column B)>> navigate to the “Data” tab.>> from the “Data Types” group>> choose “Stocks” to convert the selected data into stock information.
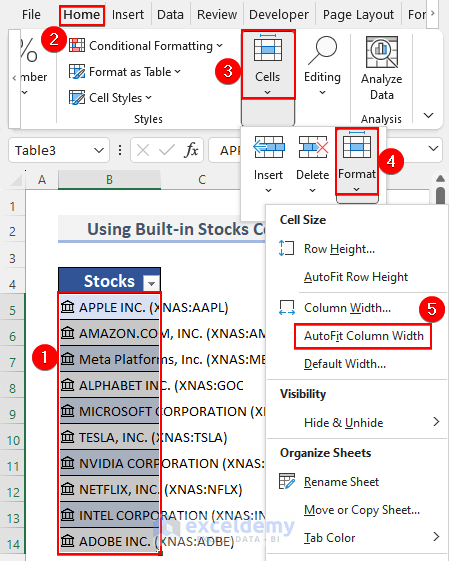
- After converting into Stocks data, you may not be able to see the full data. Select your Data >> Home>> Cells>> Format>> Autofit Column Width.
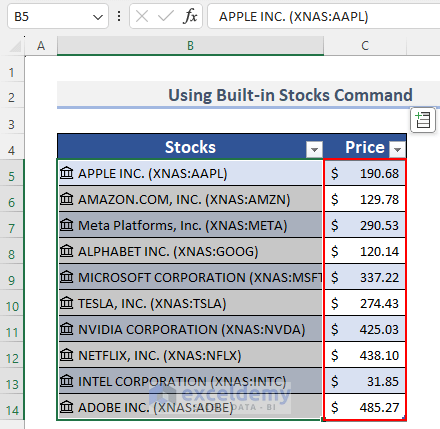
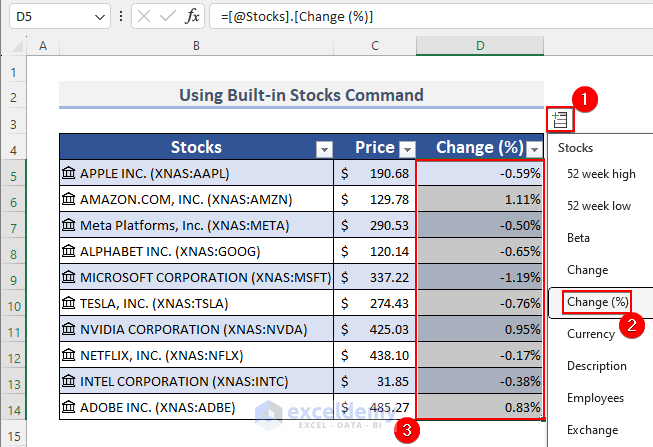
- Once the conversion is complete, you will see the corresponding results displayed. Now select your Stocks Data >> click on the Add Column >> choose Price.

- The prices of the respective stocks will be added to the adjacent column. You can add more fields to the right using the same method.
- Again, select your Stocks Data >> click on the Add Column >> choose Change (%).
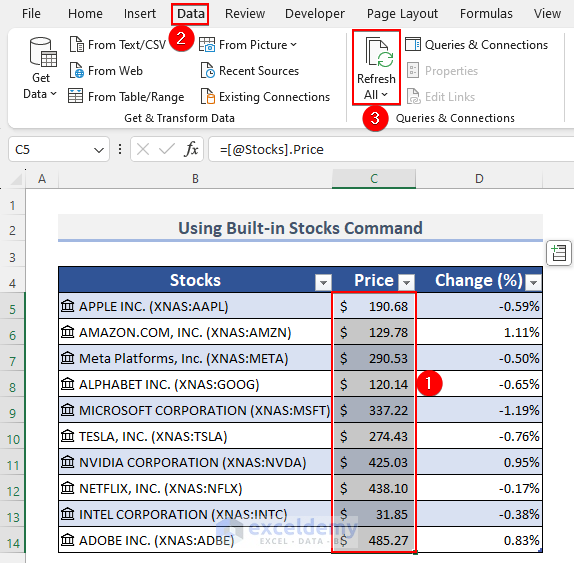
- To update the stock quotes, select the “Data” tab, followed by clicking on “Refresh All“.
How to Calculate Stocks Portfolio Value in Excel
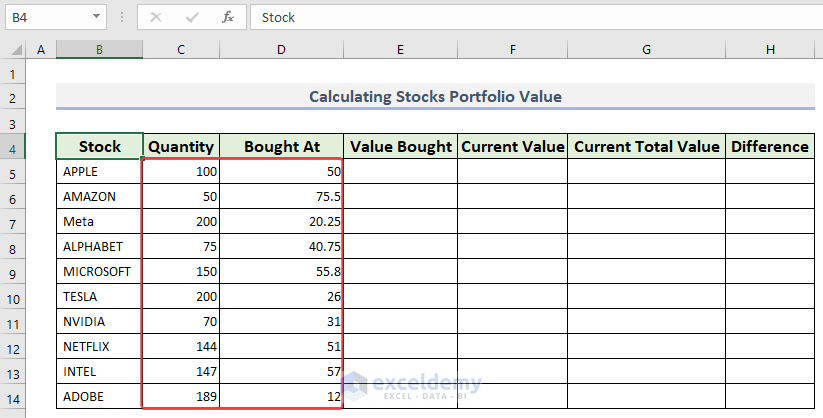
- “Bought At“: Represents the price at which each stock was purchased.
- “Current Value“: Indicates the current price or value of each stock.
- “Value Bought“: Represents the value of the stock when initially bought (Quantity * Bought At).
- “Current Total Value“: Represents the current total value of each stock (Quantity * Current Value).
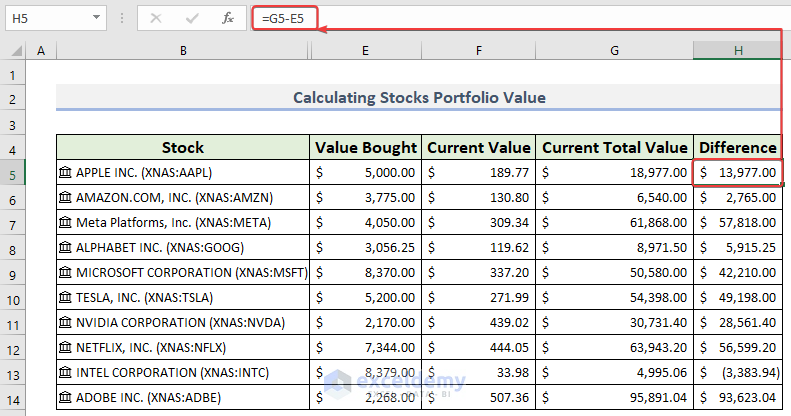
- “Difference“: Represents the difference between the Current Total Value and the Value Bought.
- The Quantity and Bought At are your data. The amount of stock bought will be filled in the Quantity column. For example, we have used some sample data for that column. You need to insert the price at which you bought the stocks in the Bought At column.
- Now multiply the number of your stocks by the unit price of the stock. To do that, you need to insert the following formula:
=C5*D5
- Select your Stock name >> go to Data tab >> select Stocks.
- After that, you need to know the current value of each stock. Excel has an amazing built-in feature to get the current price of your stock. You need to insert the following formula to get the Current Value:
=B5.Price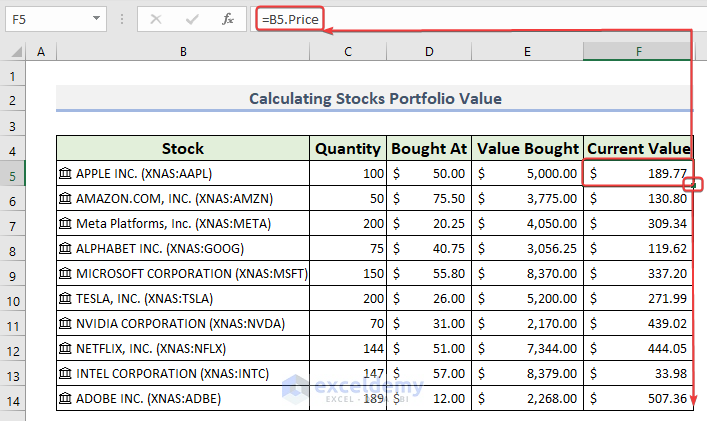
- Multiply the number of your stocks by the unit price of the stock to get the Current Value. To do that, enter the following formula to get the Current Total Value:
=C5*F5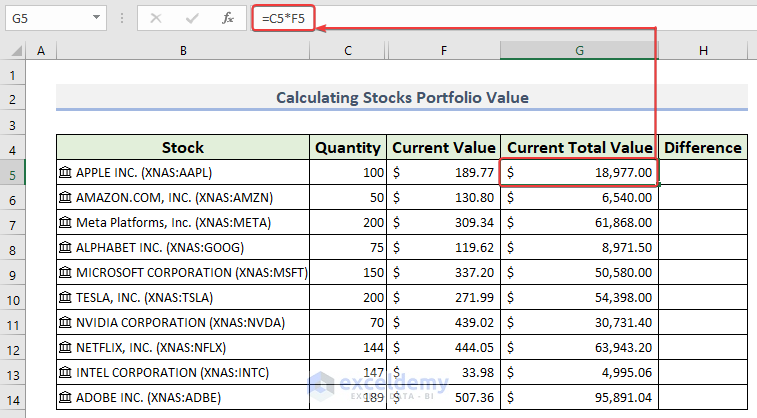
- To find the difference between the Current Total Value and Value Bought, you will get a value in the Difference column. This difference can be positive (profit) or negative (loss) depending on whether the current value is higher or lower than the value at which you bought it.
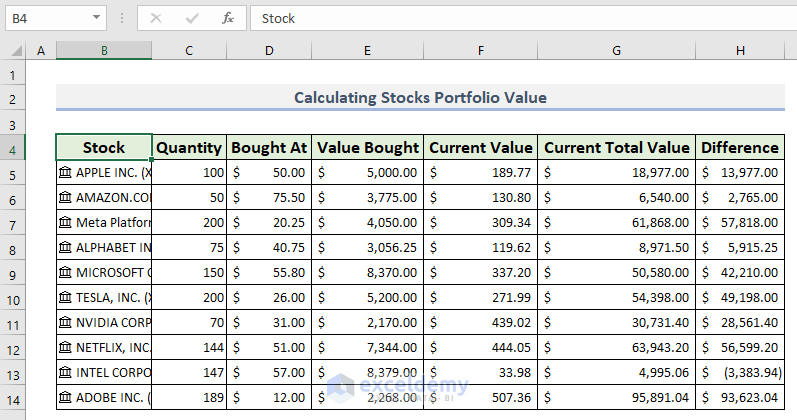
- Finally, you will get the Portfolio table in Excel, like in the following image.
How to Insert Stock Chart in Excel
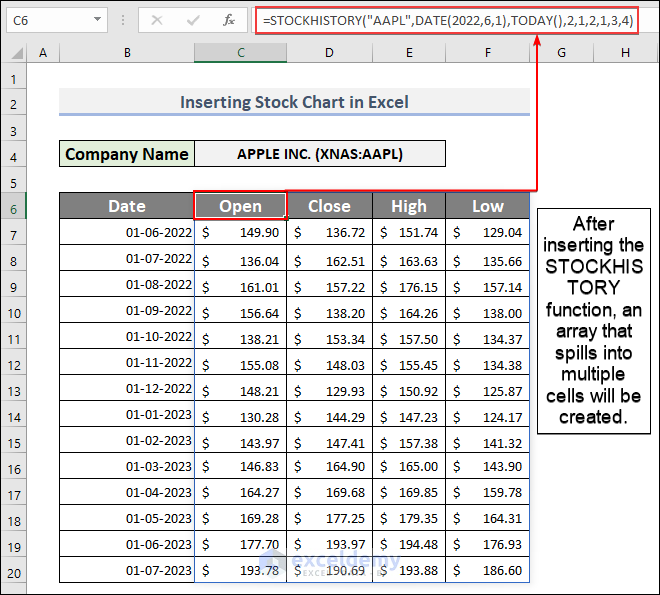
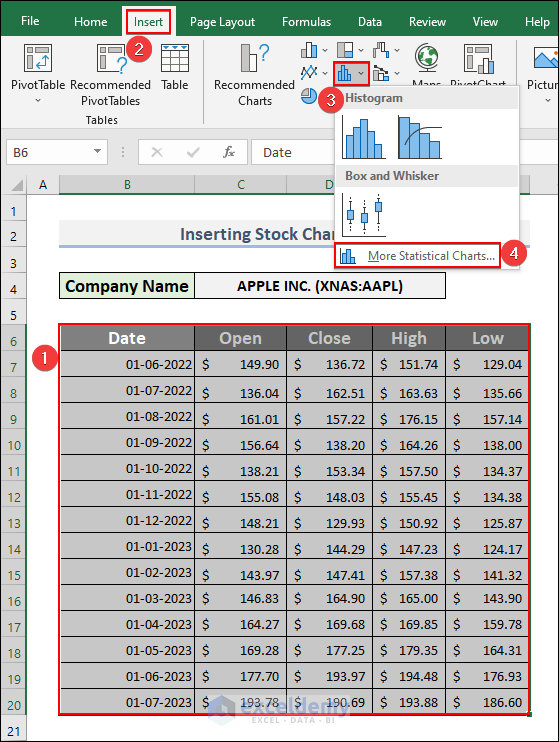
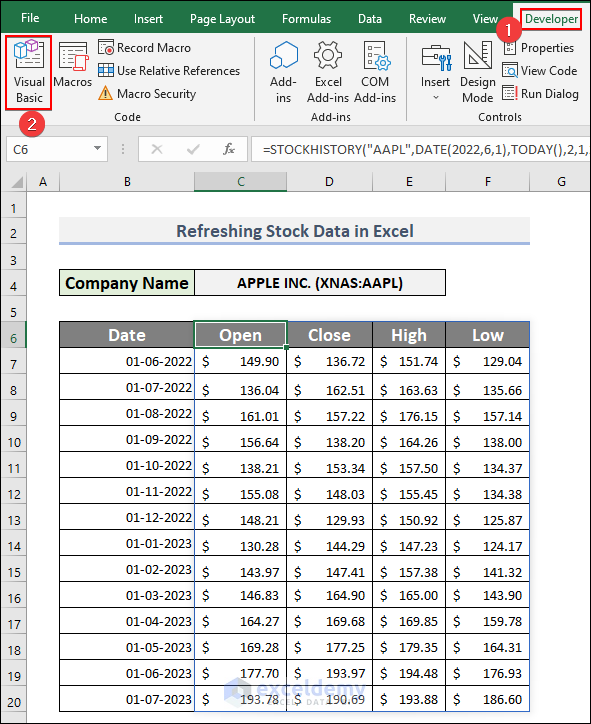
Suppose you want a chart that has columns of Open, Close, High, and Low on the first day of each month.
- You can insert the following single formula that will give you that whole table:
=STOCKHISTORY("AAPL",DATE(2022,6,1),TODAY(),2,1,2,1,3,4)=STOCKHISTORY(stock, start_date, [end_date], [interval], [headers], [properties], …)
Here,
- “STOCKHISTORY” will return you historic stock data.
- DATE (2022, 6, 1) is a start_date.
- [end_date] is TODAY().
- The optional argument [interval] is 2. (Daily = 0, weekly = 1, monthly = 2. (Default is 0)
- The optional argument [headers] is 1, where No header = 0, basic header = 1, instrument + header = 2. The default is 1.
- The optional arguments [properties] are 2, 1, 3, 4, where 2= open (opening price on the last trading day in the period), 1=close (Closing price on the last trading day in the period), 3=high (highest price in the period), and 4=Low (Lowest price in the period).
- Select your table >> go to Insert tab >> select Insert Statistic Chart >> then choose More Statistic Charts…
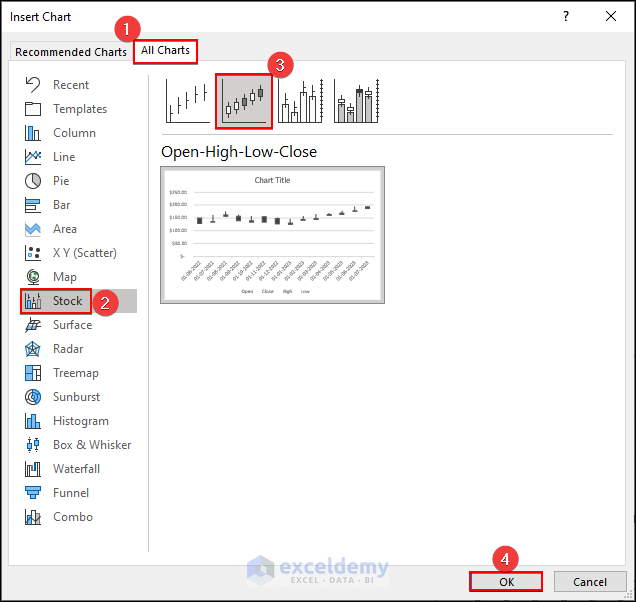
- An Insert Chart window will appear. Now follow the path: All Charts>> Stock>> Open-High-Low-Close>> OK.
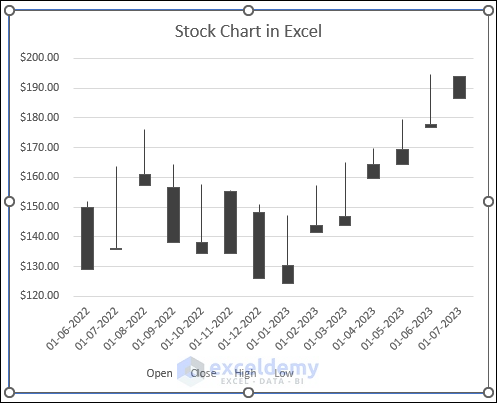
- The final image of the Stock Chart in Excel is provided in the following image.
How to Refresh Stocks Data in Excel
1. Using the Refresh All Command to Refresh Stock Data Manually
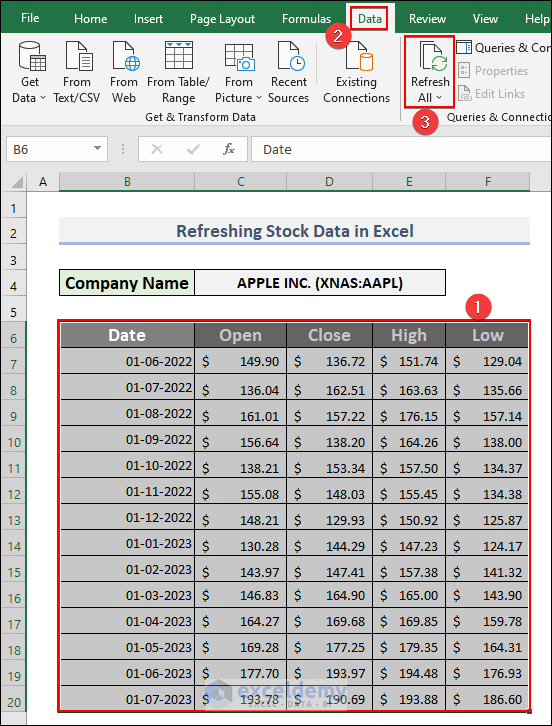
- To update the stock data manually, you can simply select a cell or table that has the stock information, choose the “Data” tab, and then “Refresh All” from the menu. This will update the selected one.
2. Using VBA to Refresh Stock Data Each Time Workbook is Opened
- Use the VBA code to force an automatic stock data refresh each time your workbook is opened. Go to the Developer tab and select Visual Basic.
- Simply paste the following code into the ThisWorkbook folder and save the code.
Private Sub Workbook_Open()
ThisWorkbook.RefreshAll
MsgBox "Stock Data has been updated!"
End Sub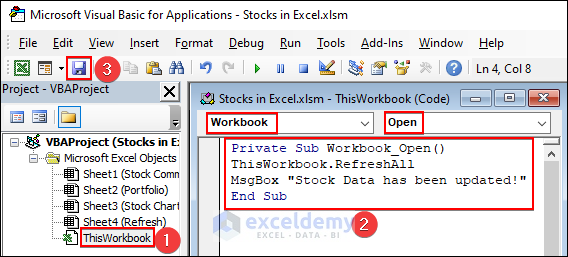
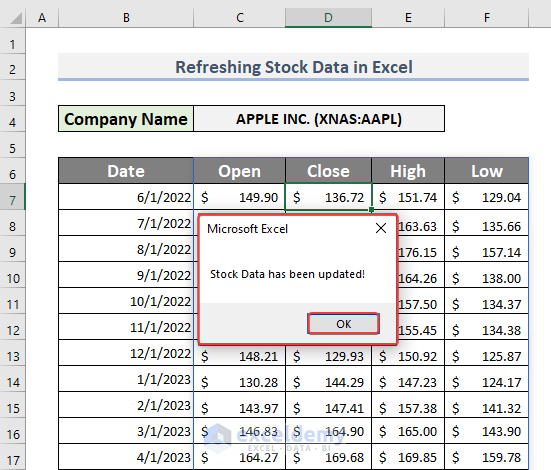
- After opening the Stocks in the Excel workbook, you will see the following message box every time. Click OK on the message box that contains the message “Stock Data has been updated”
Things to Remember
Refresh Data: The value of stocks fluctuates frequently. If your stock price sheet is dynamic, regularly update the information to reflect the most recent prices. Using tools like Power Query or macros, you can automatically refresh the data or set up manual data refresh.
Charts and Graphs: Use Excel’s charting features to visualize stock price information. To see price trends over time, make line charts or candlestick charts. To improve readability and clarity, customize the charts with the proper axes, labels, and formatting options.
Analyzing Price Changes: Use Stocks’ Add Column feature to examine and compute price changes, percent changes, and other stock price movement-related metrics. Insights into trends, volatility, or performance over specific periods can be gained from these calculations.
Frequently Asked Questions (FAQs)
1. How do I figure out my stock portfolio’s total value in Excel?
Answer: The total value of your stock portfolio can be determined in Excel by multiplying the quantity of each stock by its corresponding price, then adding the results using the SUM function.
2. How do I make an Excel stock performance chart?
Answer: You can choose the historical stock prices and dates to use when creating a stock performance chart in Excel. You can then insert a line chart or candlestick chart to show the price trends over time.
3. Can Excel import data from stock market indices?
Answer: Yes, you can use a variety of data sources or APIs to import stock market indices into Excel. To import stock market index data into Excel, many financial websites and data providers offer downloadable data files or APIs.
Conclusion
This blog post explores the management and analysis tools for stocks in Excel. Users can track stocks, make informed investment decisions, and gain market insights by using the methods and formulas discussed. Investors benefit greatly from Excel’s strong features, which include trend visualization and data import. Keep in mind to use thorough market research and Excel as supplements. Stay tuned for more instructive blog posts on Excel and finance, download the practice workbook, and post any questions or comments in the comments section.
Stocks in Excel: Knowledge Hub
- Add Stock Data Type
- [Solved]: Data Types Stocks and Geography Missing Problem in Excel
- Get Stock Prices
- Get Live Stock Prices
- Import Stock Prices into Excel from Google Finance
- Import Stock Prices into Excel from Yahoo Finance
- Download Historical Stock Data into Excel
- Historical Data of NSE stocks in Excel
- How to Track Stocks in Excel
- Get Current Stock Price of India
- Automatically Update Stock Prices
- Track Stock Prices
- Get Stock Quotes
- Get Stock Quote with Excel Add-in
- Calculate Correlation Between Two Stocks
- Calculate Alpha
- Calculate Alpha of a Stock
- Calculate Beta
- Calculate CAPM Beta
- Calculate Alpha and Beta
<< Go Back to Excel for Finance | Learn Excel

