In this article, we will show you different methods to calculate outliers in Excel. You will get to know about various statistical concepts and Excel formulas to identify outliers. Moreover, we will explore some methods to calculate the mean excluding outliers in Excel.
Outliers mainly refer to data points that significantly deviate from the bulk majority of data. Outliers are values that fall outside the expected range of your dataset. These outliers may have a significant impact while calculating mean or other statistical measurements. That’s why it is very important to identify them.
Download Practice Workbook
You can download this practice workbook while going through the article.
How to Find Outliers in Excel: 6 Suitable Methods
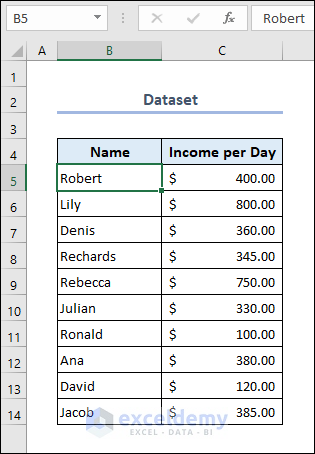
In the dataset, we have the names of multiple persons along with their income per day.
1. Apply Sort & Filter to the Dataset
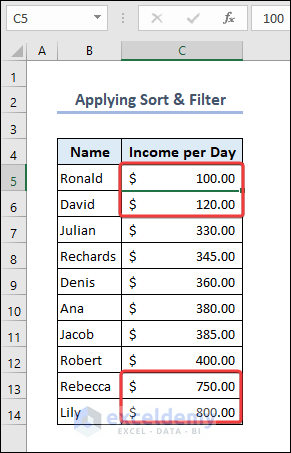
- Select cell C4 >> Home tab >> Sort & Filter >> Sort A to Z.
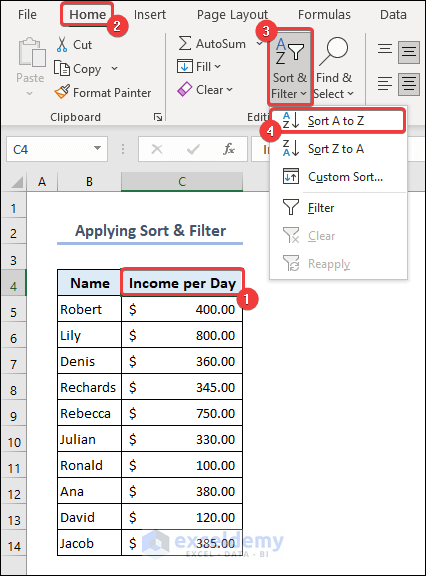
- In the sorted column C, you will see the outliers at the top and bottom.
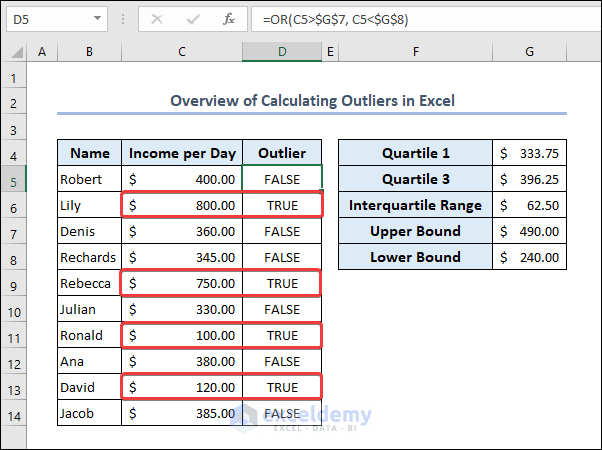
2. Combination of QUARTILE and OR Functions for Outliers
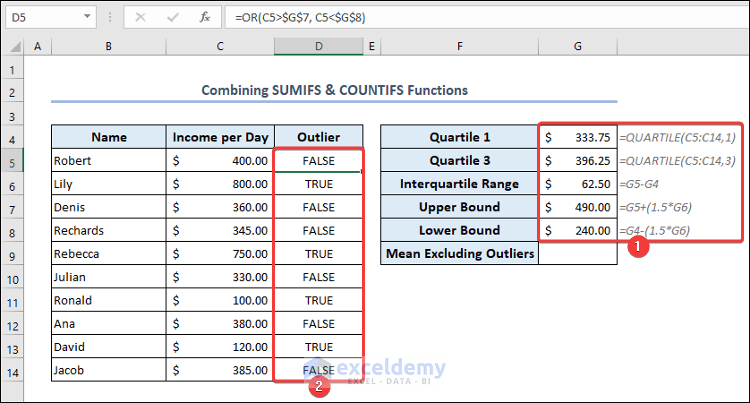
- Put the following formulas one by one in each cell of range G4:G8. Some of the formulas include the application of the QUARTILE function.
Formula of 1st Quartile (cell G4):
=QUARTILE(C5:C14,1)Formula of 3rd Quartile (cell G5):
=QUARTILE(C5:C14,3) Formula for Interquartile Range (cell G6):
=G5-G4Formula of Upper Bound (cell G7):
=G5+(1.5*G6)Formula of Lower Bound (cell G8):
=G4-(1.5*G6)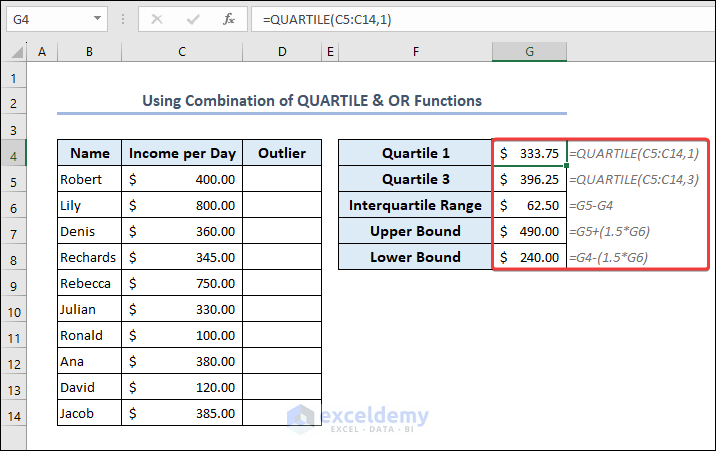
You can use the QUARTILE.INC function instead of the QUARTILE function as well.
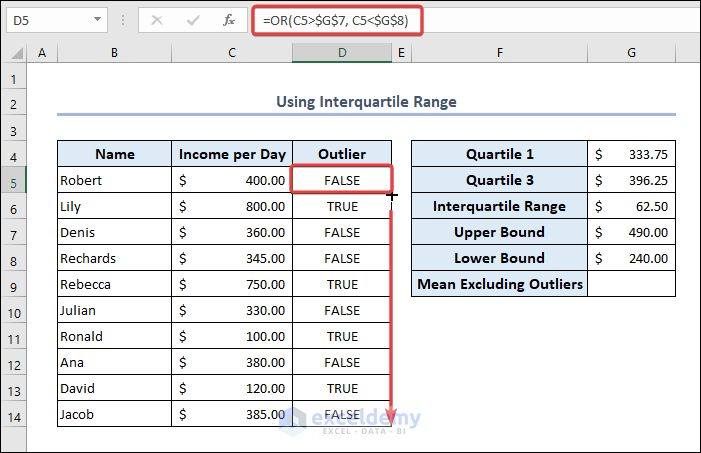
- Go to cell D5 and put the following formula based on the OR function.
=OR(C5>$G$7, C5<$G$8)- Select cell D5 and use Fill Handle to AutoFill data in range D6:D14.
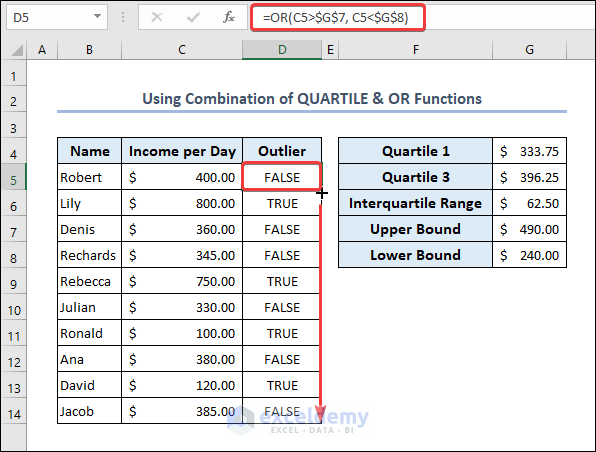
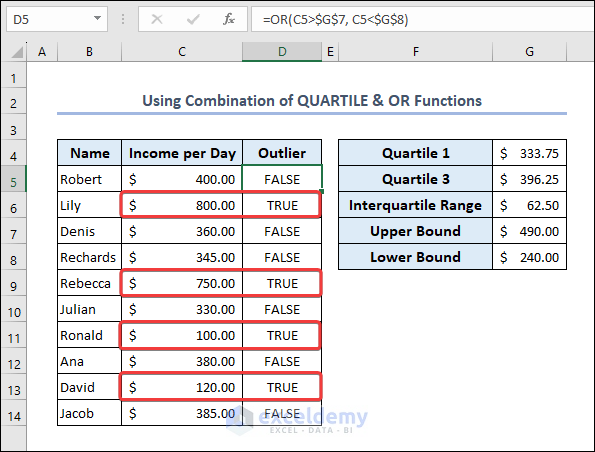
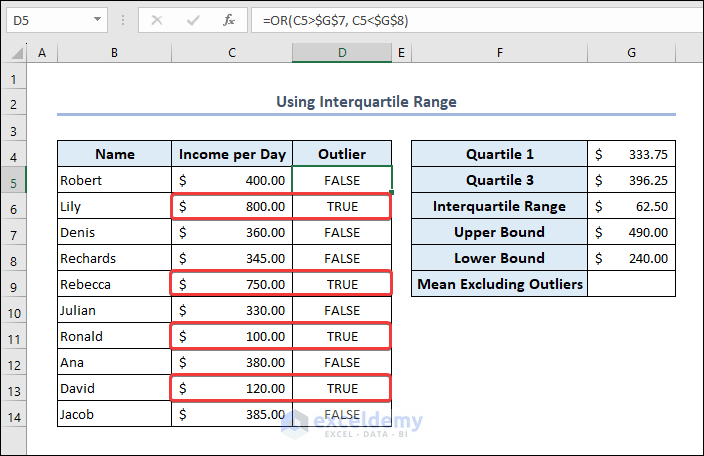
- The formula will return a TRUE statement if the specific data is an outlier and will return a FALSE statement otherwise.
3. Apply AVERAGE, STDEV.P and OR Functions for Outliers
- Put the following formulas one by one in each cell of range G4:G7. Some of the formulas include the application of the AVERAGE function and the STDEV.P function.
Formula of cell G4:
=AVERAGE(C5:C14)Formula of cell G5:
=STDEV.P(C5:C14)Formula of cell G6:
=G4+(1.5*G5)Formula of cell G7:
=G4-(1.25*G5)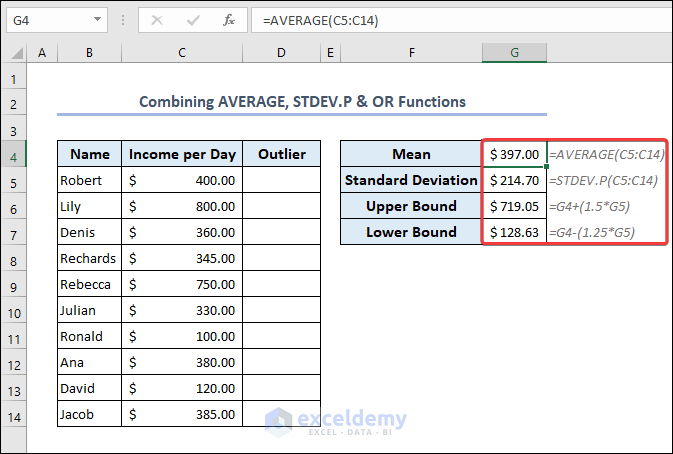
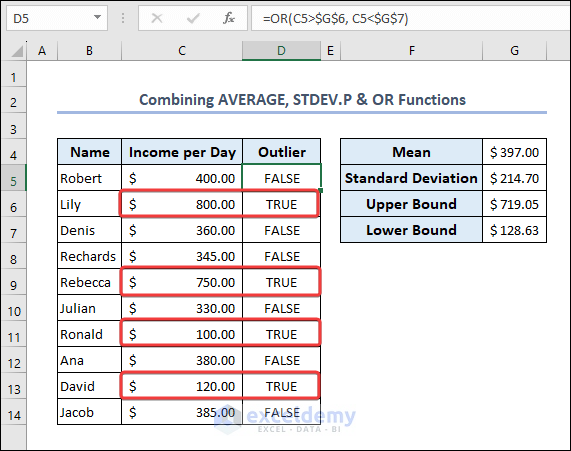
- Go to cell D5 and put the following formula based on the OR function.
=OR(C5>$G$6, C5<$G$7)- Select cell D5 and use Fill Handle to AutoFill data in range D6:D14.
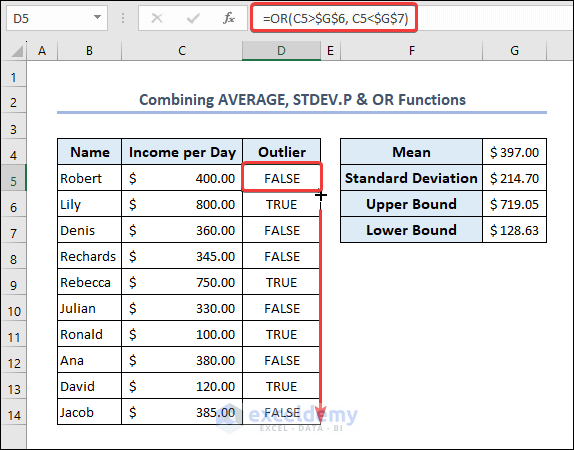
- The formula will return a TRUE statement if the specific data is an outlier and will return a FALSE statement otherwise.
Read More: How to Calculate Outliers in Excel
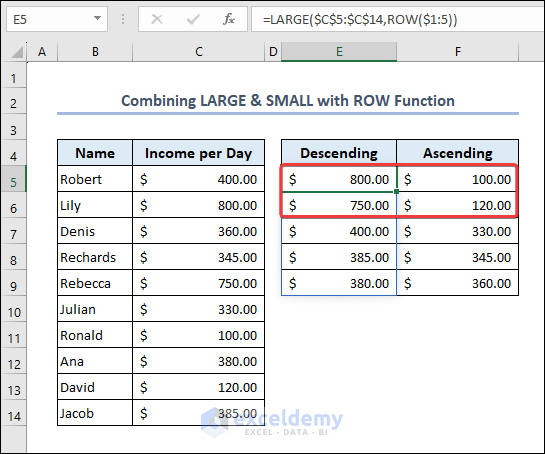
4. Combine LARGE & SMALL Functions with ROW Function for Outliers
- Go to cell E5 and put the following formula based on the combination of the LARGE function and the ROW function and press Enter.
=LARGE($C$5:$C$14,ROW($1:5))
- Go to cell F5 and put the following formula based on the combination of SMALL and ROW functions and press Enter.
=SMALL($C$5:$C$14,ROW($1:5))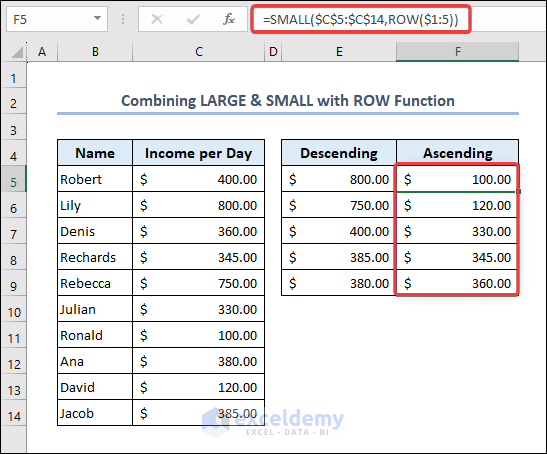
- You will see the outliers at the top of the range E5:F9.
5. Find Z-Score to Calculate Outliers in Excel
Now, we’ll show how to find Z-score to calculate outliers in Excel.
- Put the following formulas in cells H4 and H5 respectively based on the AVERAGE and STDEV.P functions.
Formula of cell H4:
=AVERAGE(C5:C14)Formula of cell H5:
=STDEV.P(C5:C14)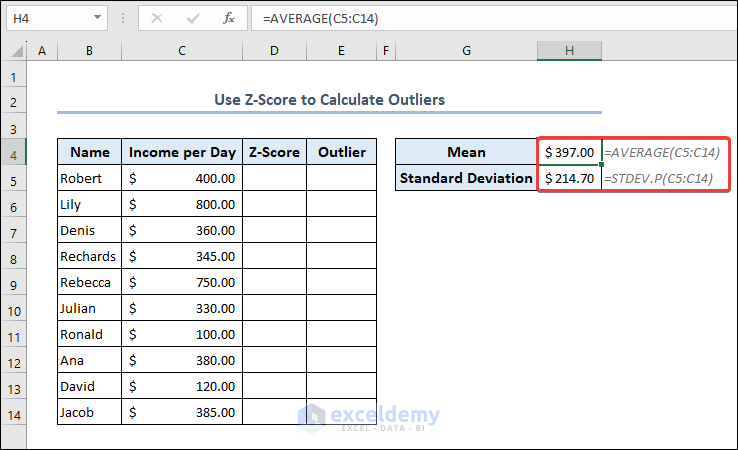
- Go to cell D5 and put the following formula into the cell.
=(C5-$H$4)/$H$5- Select cell D5 and use Fill Handle to AutoFill data in range D6:D14.
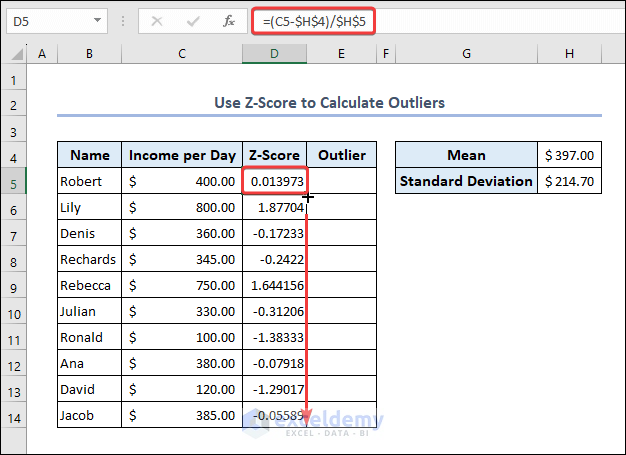
You can see the value of the Z-score in the range D5:D14.
- Go to cell E5 and put the following formula based on the OR function depending on the value of the Z-score.
=OR(D5>1.5, D5<-1.25)- Select cell E5 and use Fill Handle to AutoFill data in range E6:E14.
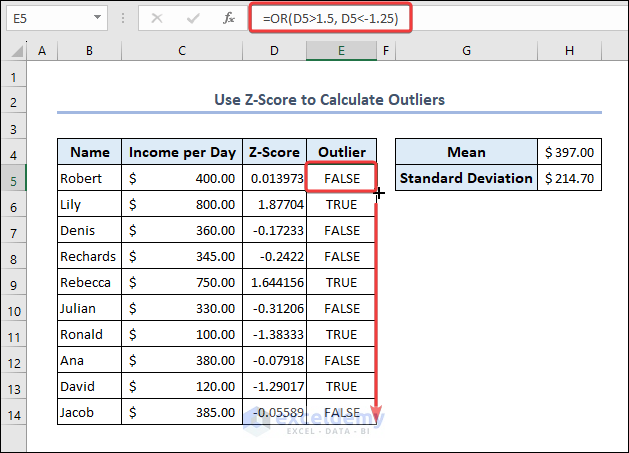
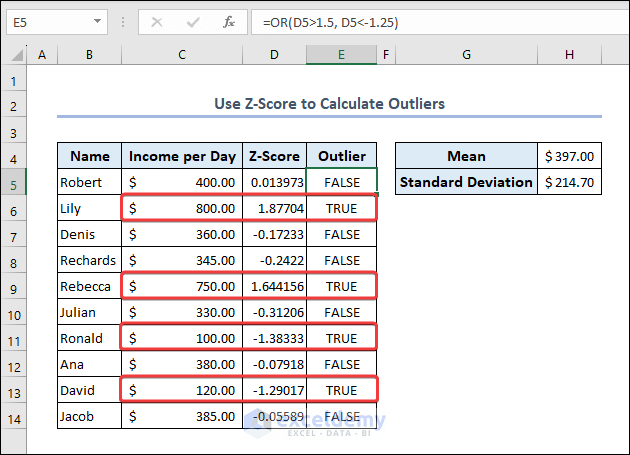
- The formula will return a TRUE statement if the specific data is an outlier and will return a FALSE statement otherwise.
6. Use Graph to Find Outliers
- Select the entire dataset of range B4:C14 >> go to the Insert tab >> select Scatter plot from the Charts group.
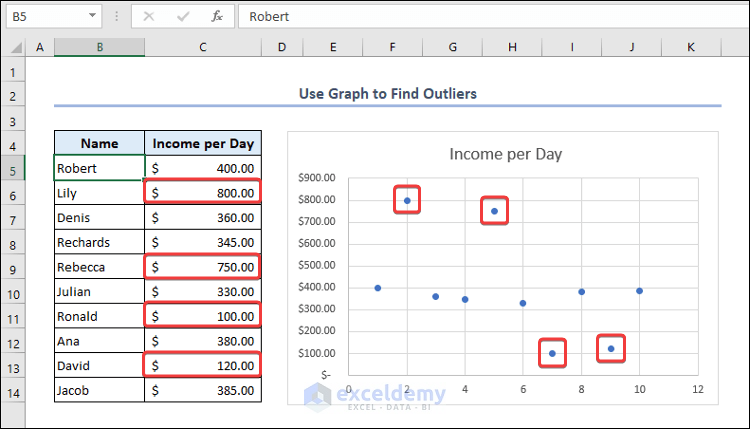
- You will see a Scatter plot of the dataset.
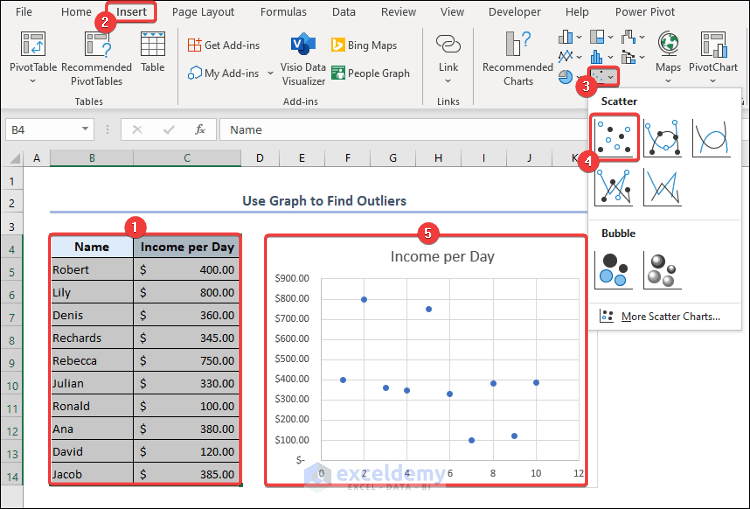
- You can quickly identify outliers in this graph.
How to Calculate Mean Excluding Outliers in Excel
1. Use the TRIMMEAN Function to Get Mean Excluding Outliers
- Go to cell C15 and put the formula based on the TRIMMEAN function.
=TRIMMEAN(C5:C14,40%)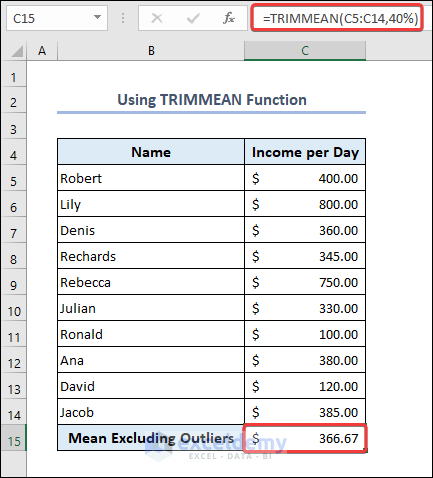
You can see the mean value in cell C15 excluding outliers from the top 20% and bottom 20% of the dataset.
2. Apply the AVERAGEIFS Function for Mean Excluding Outliers
- Go to cell C15 and put the formula based on the AVERAGEIFS function depending on the income value.
=AVERAGEIFS(C5:C14,C5:C14,">300",C5:C14,"<500")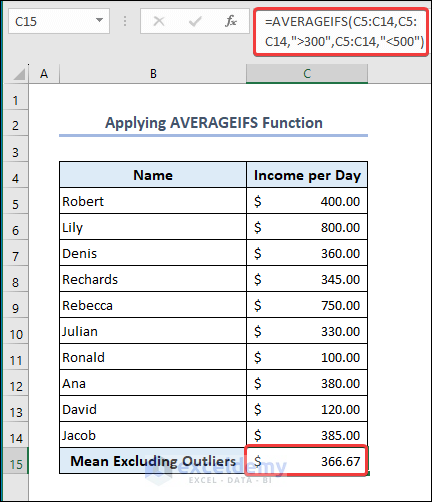
You will see the mean value in cell C15 excluding outliers.
3. Use Interquartile Range for Mean Excluding Outliers
- Put the following formulas one by one in each cell of range G4:G8. Some of the formulas include the application of the QUARTILE function.
Formula of cell G4:
=QUARTILE(C5:C14,1)Formula of cell G5:
=QUARTILE(C5:C14,3)Formula of cell G6:
=G5-G4Formula of cell G7:
=G5+(1.5*G6)Formula of cell G8:
=G4-(1.5*G6)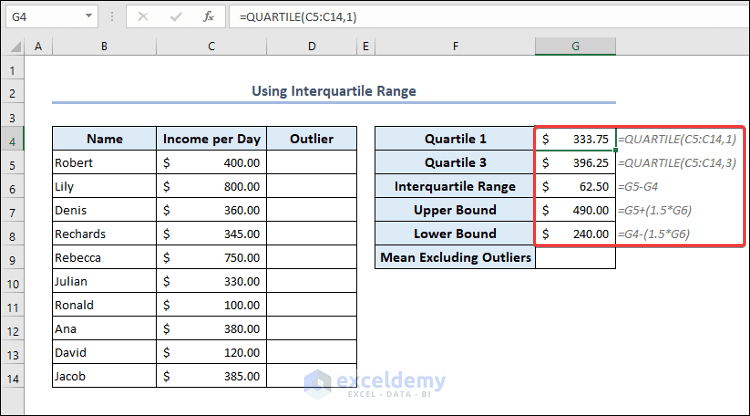
- Go to cell D5 and put the following formula based on the OR function.
=OR(C5>$G$7, C5<$G$8)- Select cell D5 and use Fill Handle to AutoFill data in range D6:D14.
- The formula will return a TRUE statement if the specific data is an outlier and will return a FALSE statement otherwise.
- Go to cell G9 and put the formula based on the AVERAGEIFS function.
=AVERAGEIFS(C5:C14,D5:D14,"False")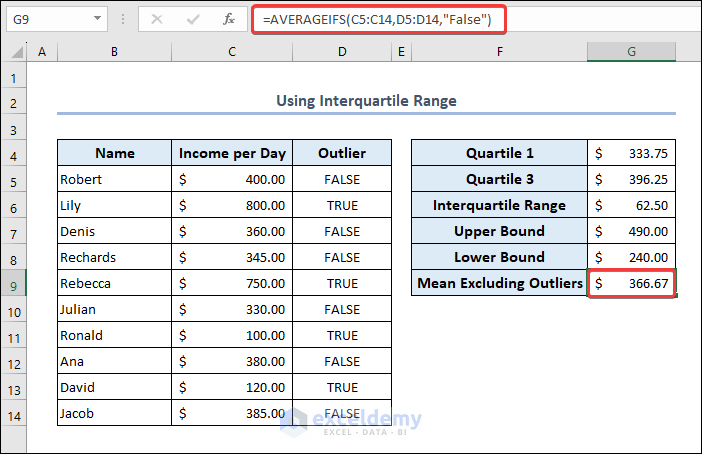
This will return the mean value excluding outliers in cell G9.
4. Combine SUMIFS and COUNTIFS Functions to Calculate Mean without Outliers
- Calculate the outliers by following the previous method step by step.
- Go to cell G9 and put the formula based on the combination of the SUMIFS function and the COUNTIFS function.
=SUMIFS(C5:C14,D5:D14,"False")/COUNTIFS(D5:D14,"False")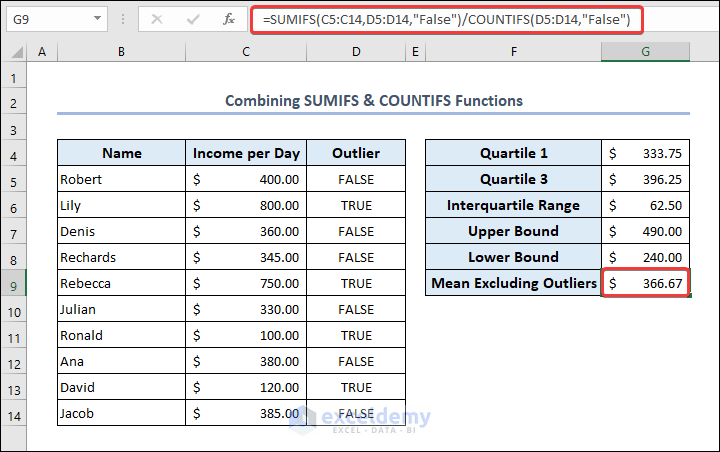
This will return the mean value excluding outliers in cell G9.
This formula calculates the sum of values in range C5:C14 that correspond to cells in range D5:D14 containing the text False. Then, it divides that sum with the number of cells from the range D5:D14 that also contain the text False. So, this formula calculates the mean value excluding the outliers.
Things to Remember
There are a few things to remember when looking for outliers in Excel:
- While looking for outliers through a graph, it is best to choose the Scatter plot.
- Use appropriate formulas to calculate outliers.
- Understand the context of your dataset to locate outliers in your analysis.
Frequently Asked Questions
1. What is the difference between the QUARTILE and QUARTILE.INC functions?
Both these functions calculate quartiles in Excel. However, the QUARTILE.INC function is compatible with recent versions of Excel and the QUARTILE function is available for compatibility with Excel 2007 and earlier.
2. How can I visualize outliers in Excel?
You can visualize outliers by creating appropriate plots from your dataset. You can create a Scatter plot, Box plot, or any other plotted graph that suits you to analyze your dataset.
3. How do I handle missing values while identifying outliers in Excel?
You should set the cell references correctly in your formula. However, in large datasets, missing some values may not create any significant difference in your calculation.
Conclusion
In this article, we have discussed in detail about finding outliers in Excel. You will get to know about different methods to calculate outliers. This article will allow users to analyze their dataset in Excel more efficiently and effectively. If you have any suggestions or recommendations regarding this article, feel free to let us know in the comment section.
Outliers in Excel: Knowledge Hub
- Show Outliers in Excel Graph
- Find Outliers in Regression Analysis
- Find Outliers with Standard Deviation
- Remove Outliers from Excel Scatter Plot

