In this article, We will learn to calculate various types of standard error in Excel. First, we will learn the Standard Error of Mean. The standard error of the mean (SEM) measures the sample mean’s deviation from the population mean. We will learn different methods to calculate the standard error of mean.
We will also cover SEM(Standard Error of Mean), Standard error of regression, and standard error of skewness. Skewness represents the degree of asymmetry in a given set of data. In a distribution, when the tail on the left side is longer, you may say that the distribution is negatively skewed (left-skewed). On the contrary, a distribution will be positively skewed (right-skewed) if the tail on the right side is longer than on the left side.
Download Practice Workbook
What Is Standard Error?
When dealing with real-world data, it is not always possible to use data from the entire population. As a result, we usually work with random samples drawn from the population. The standard error of the sample indicates how close its mean is to the true population mean.
How to Calculate Standard Error of Mean in Excel
In mathematics, the standard error of mean can be calculated by dividing the Standard Deviation and the square root of sample size.
SEM= SD/√nHere SD is the standard deviation and n is the sample size.
1. Using Excel Formula
- We can calculate Standard Error in Excel using the Excel Formula given below. We will use the STDEV.S function to calculate standard deviation. The COUNT function will calculate the number of examples.
=STDEV.S(C5:C18)/SQRT(COUNT(C5:C18))
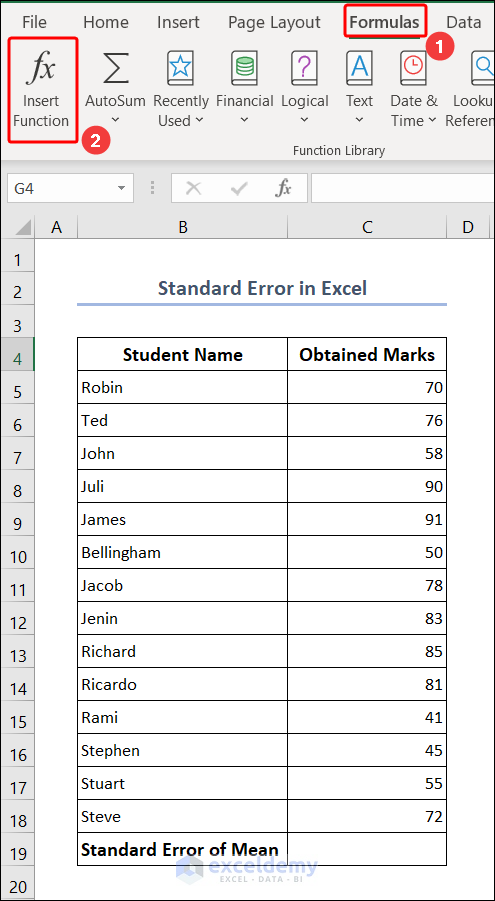
2. Using Formulas Tab
- Go to the Formulas tab and then Insert Function.
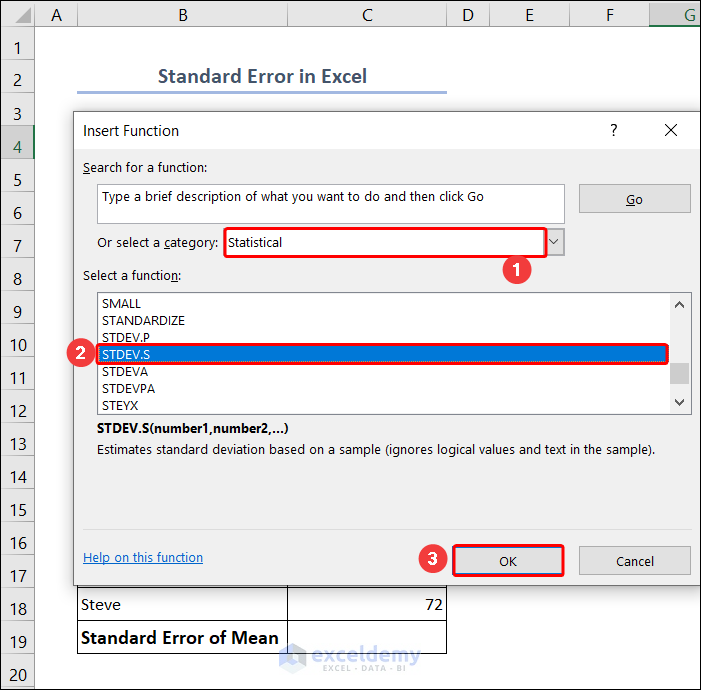
- Choose the Statistical category from the dropdown menu and select STDEV.S and click OK.
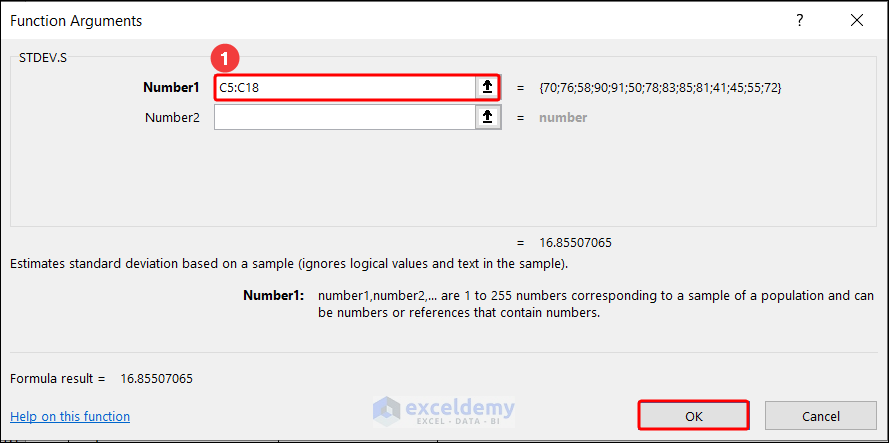
- Then give the input range C5:C18 and click OK.
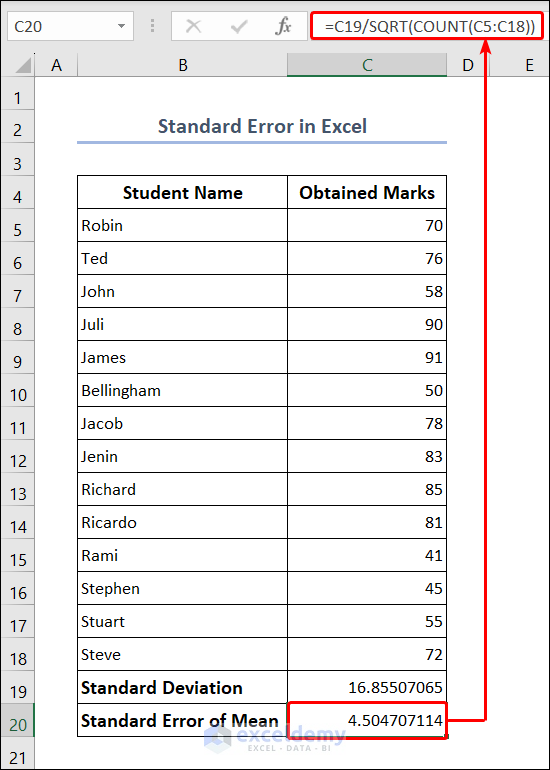
- Now enter the formula to calculate the standard error of mean.
=C19/SQRT(COUNT(C5:C18))
3. Using Data Analysis ToolPak
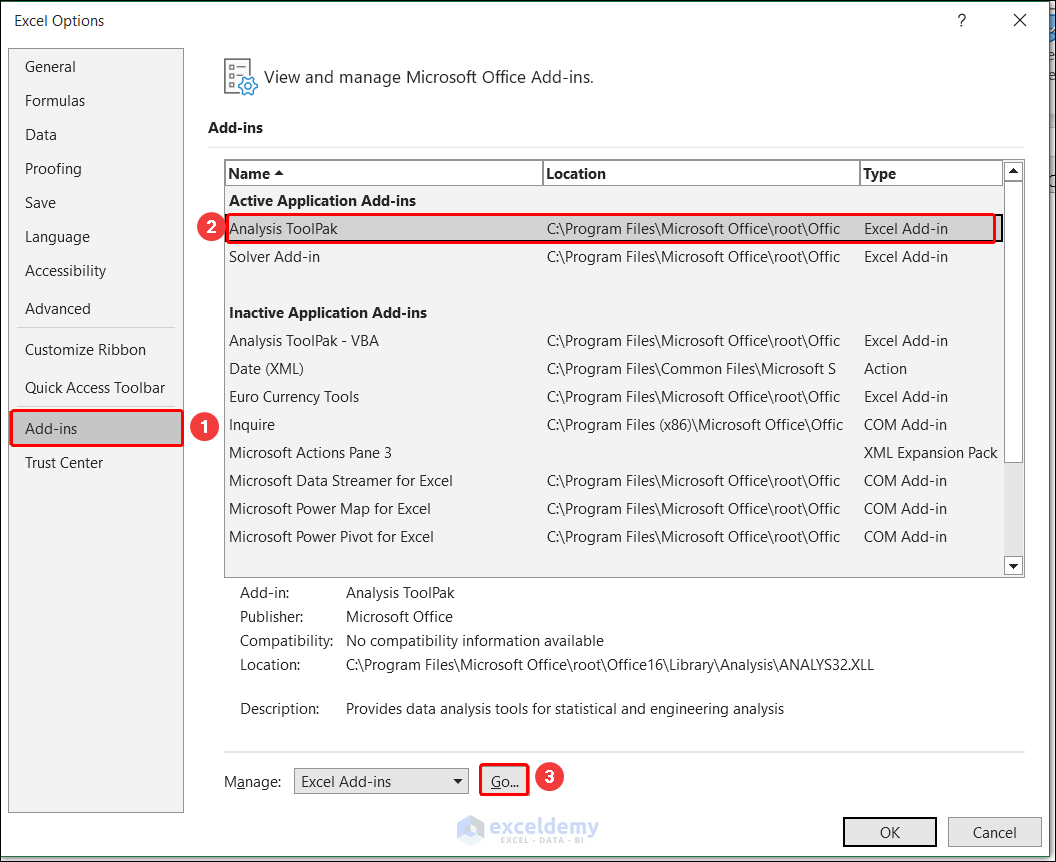
- For the data analyzing tool pack, go to the File tab.

- Select Options.

- From the Excel Options window, select Add-ins. Then select Analysis Toolpak in the Active Application Add-ins group and click on the Go button.
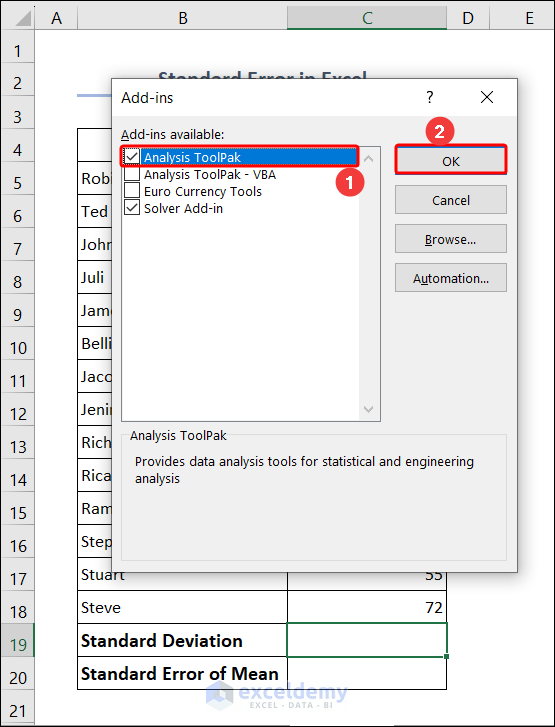
- Select Analysis Toolpak from the Add-ins window and click OK.
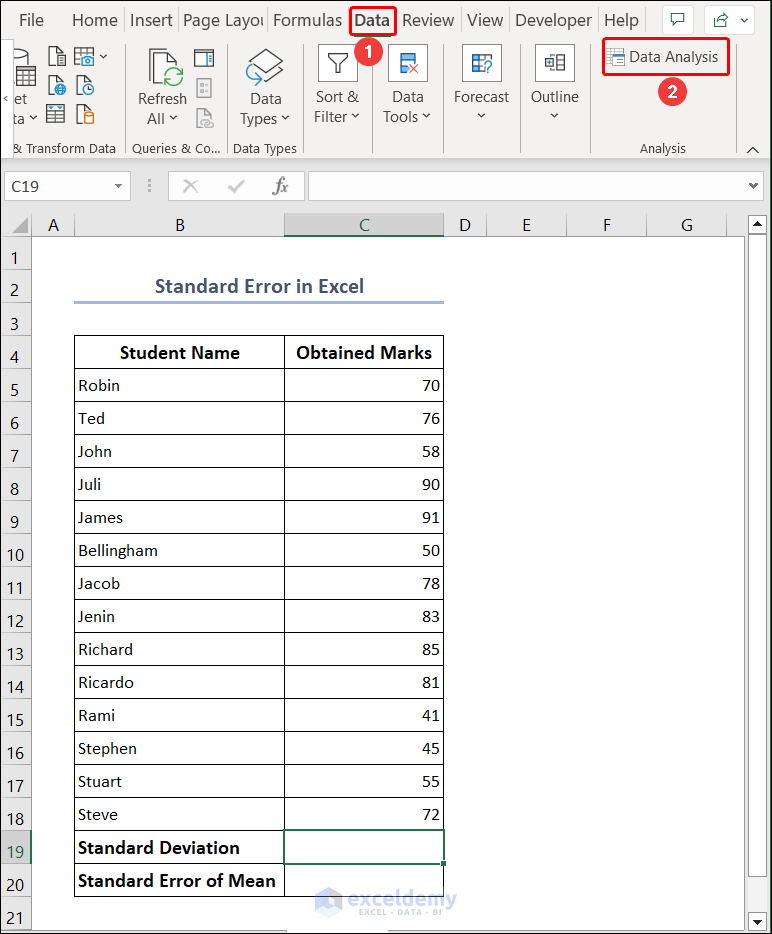
- Then go to Data >> Data Analysis.
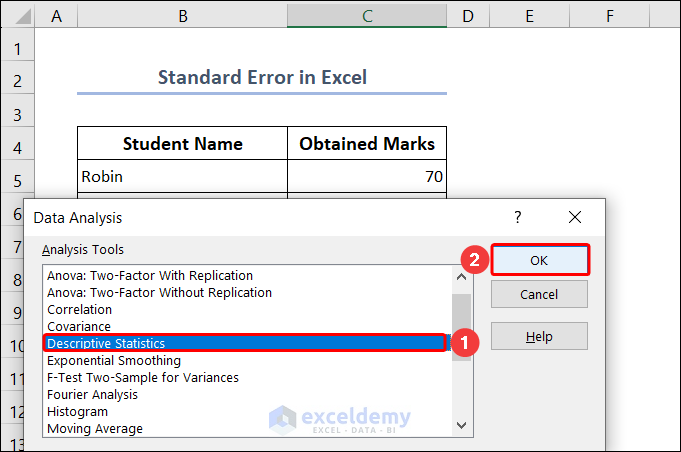
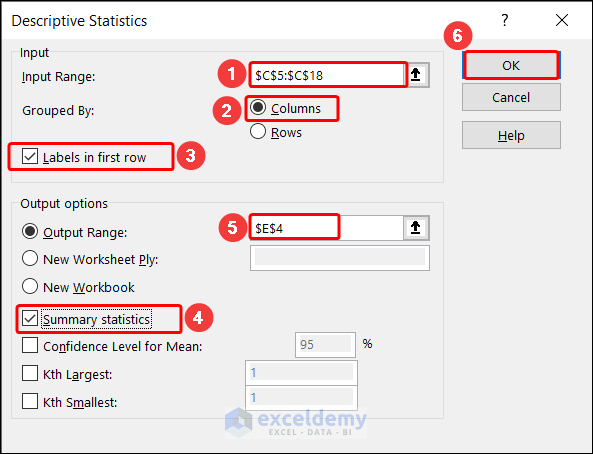
- Then select Descriptive Statistics in the Data Analysis window and select OK.
- Then again give the input range, select Columns as the Grouped By option, Select Labels in first row checkbox, enter the output range, select Summary statistics and click OK.
- Then we will get a summary of different calculations.
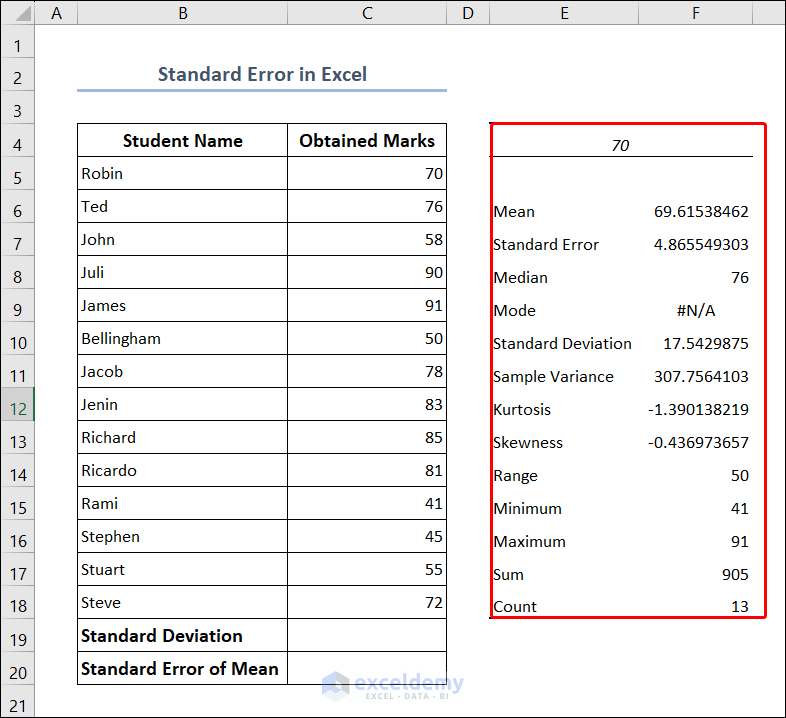
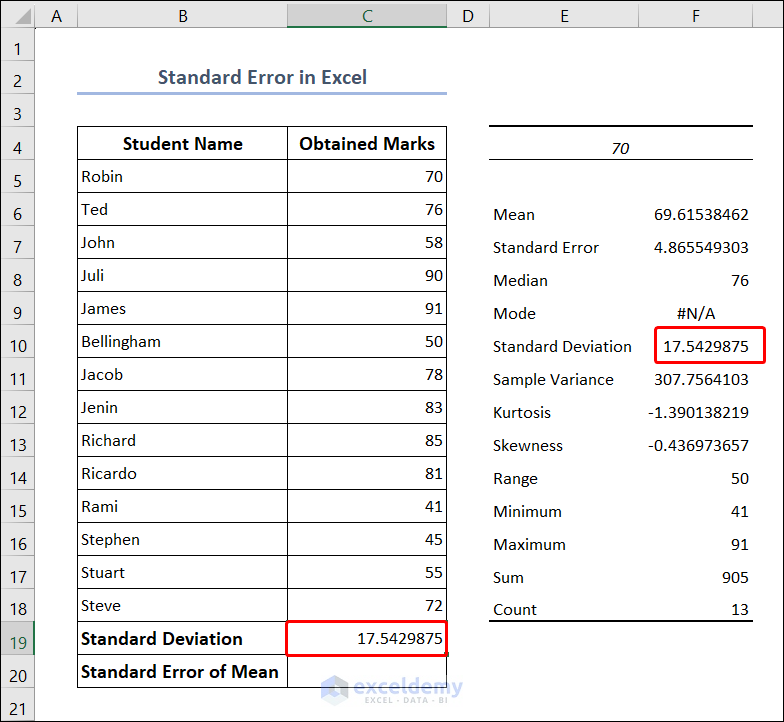
- Then look for the standard deviation. Copy the value and paste it on the C19 cell.
- Now enter the formula and calculate standard error of mean.
=C19/SQRT(COUNT(C5:C18))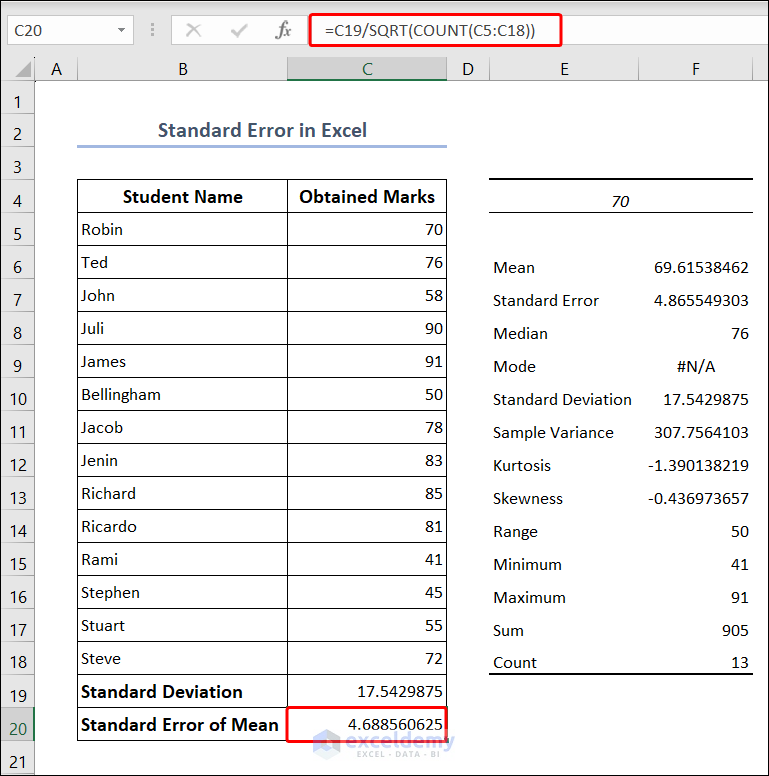
How to Calculate Standard Error of Skewness in Excel
Now, we’ll learn how to calculate standard error of skewness in Excel.
- Select cell C17 and enter the given formula.
=COUNT(C5:C16)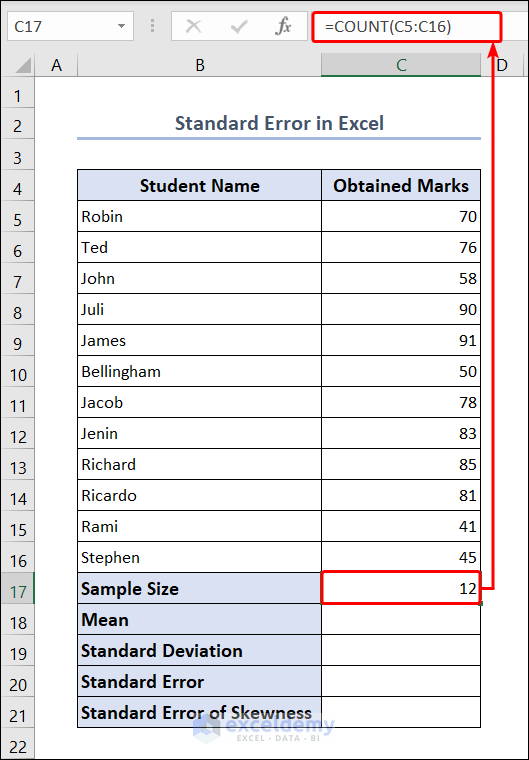
- Calculate the mean using the formula given below.
=AVERAGE(C5:C16)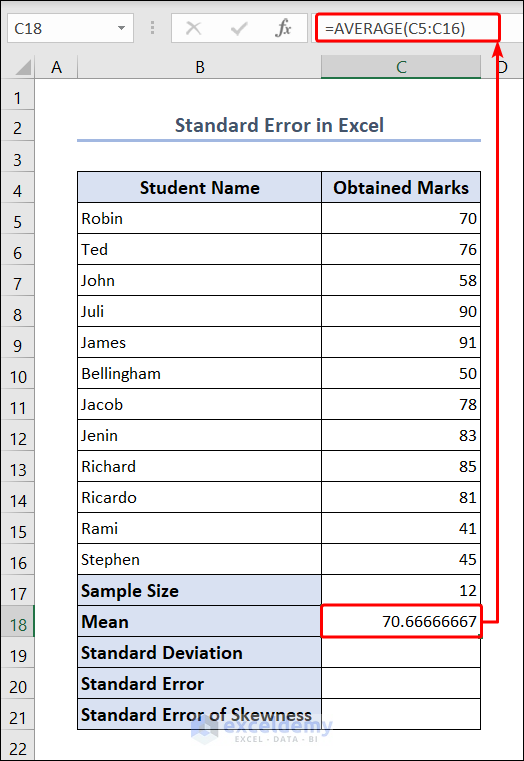
- Select cell C19 and calculate the standard deviation using the formula.
=STDEV(C5:C18)/SQRT(COUNT(C5:C18))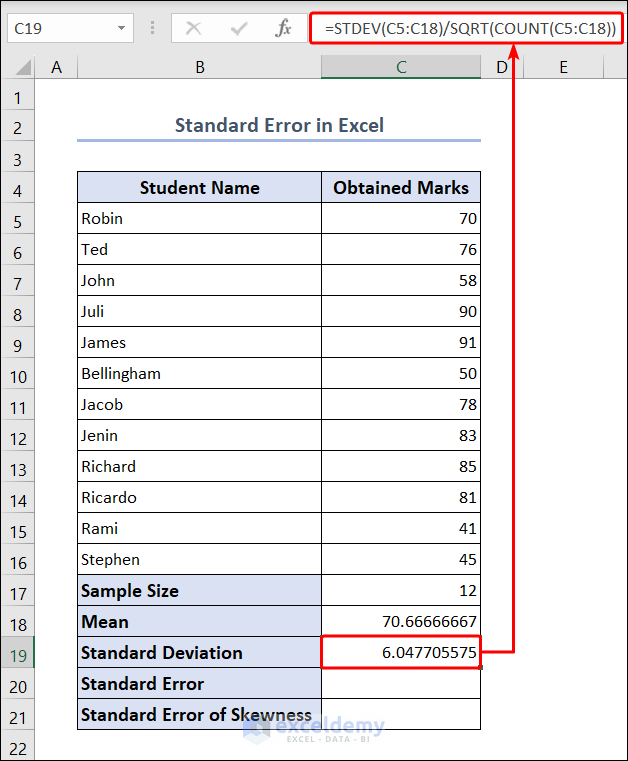
- Calculate standard error using the formula given below.
=C19/SQRT(C17)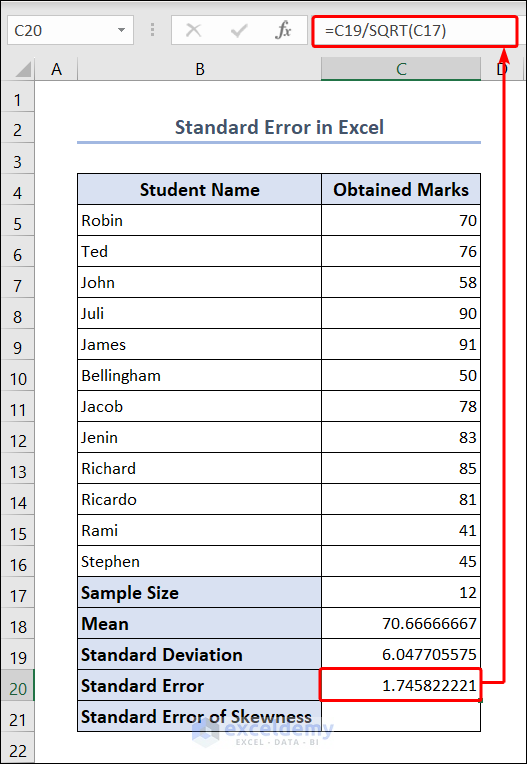
- Now calculate the standard error of skewness entering the formula in the C21 cell.
=SQRT((6*C17*(C17-1))/((C17-1)*(C17+1)*(C17+3)))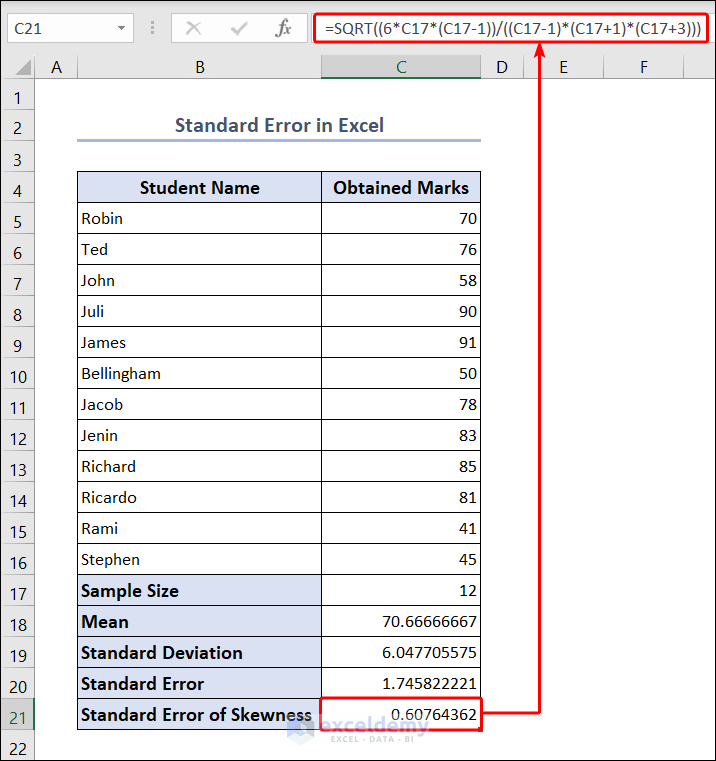
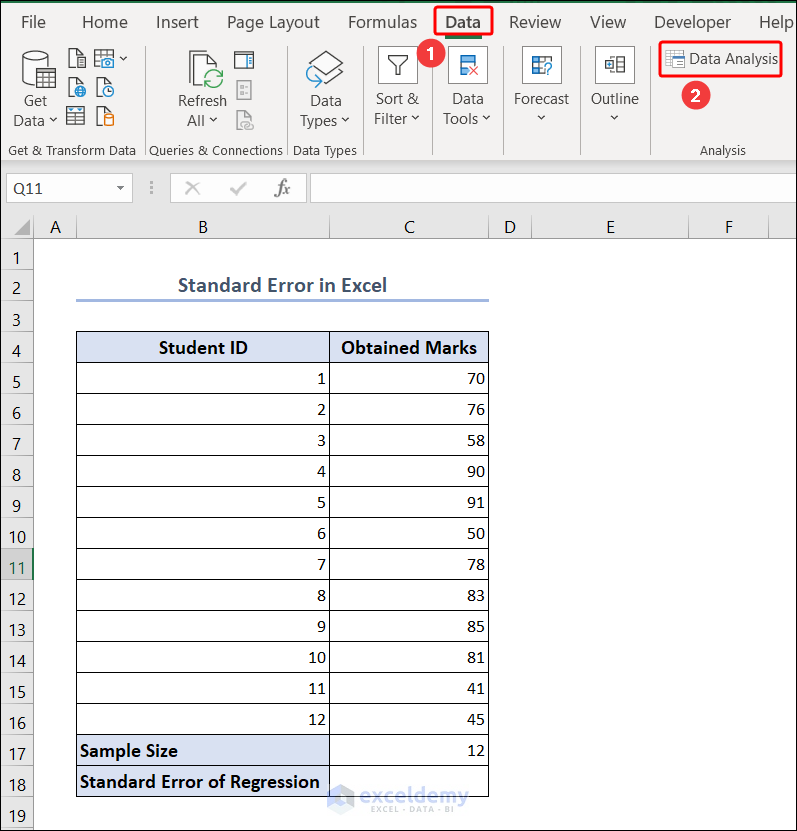
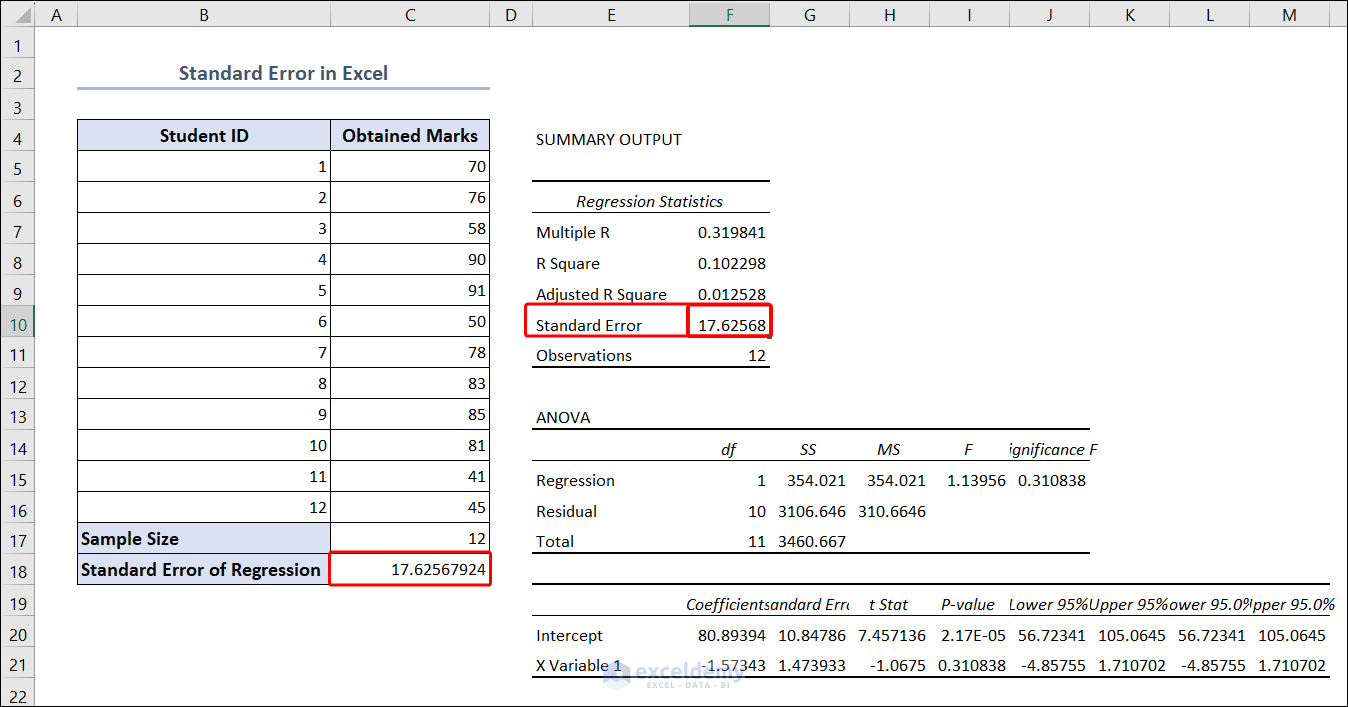
How to Calculate Standard Error of Regression in Excel
Let’s learn how to calculate standard error of regression in Excel.
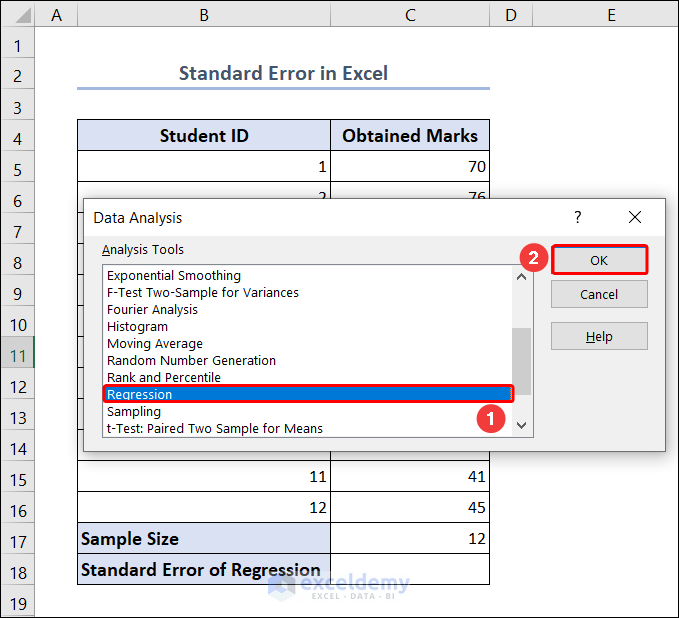
- Go to Data >> Data Analysis.
- Select Regression in Data Analysis window and click OK.
- Select cell C5:C16 as Input Y Range and B5:B16 as Input X Range. Then select the Output Range and click OK.
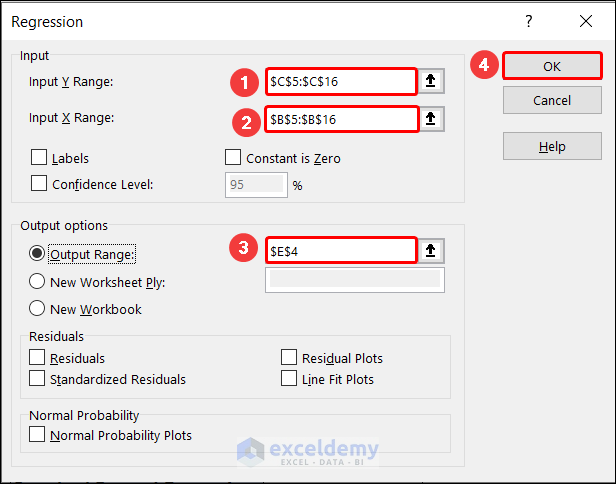
- Now copy the standard error and paste it into the C18 cell.
Read More: Calculate Standard Error of Regression Slope
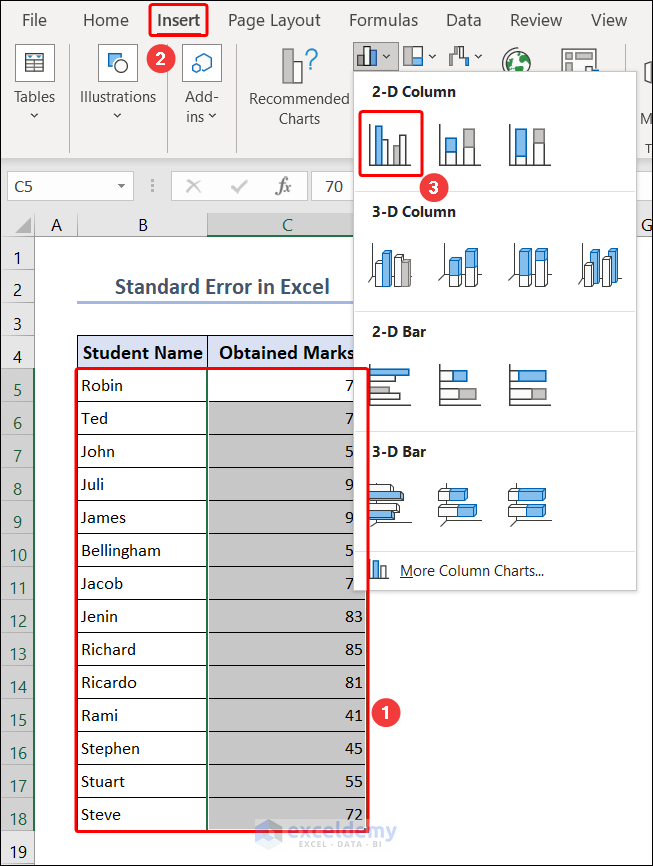
How to Add Standard Error Bars in Excel
- Select the data range B5:C18. Go to Insert >> 2-D Column. This will create a bar chart.
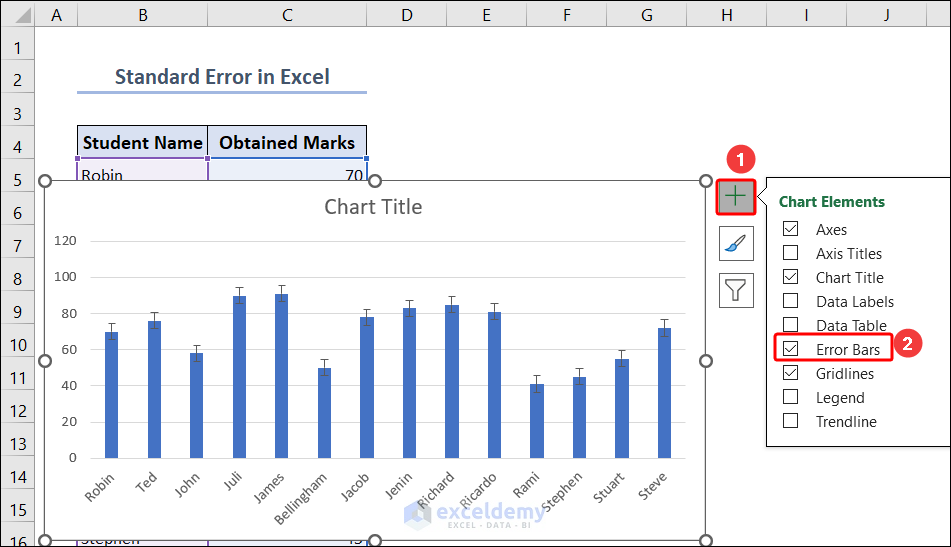
- Select the chart and click on (+) icon and check Error Bars. This will add error bars on the top of the chart.
What Are the Differences Between Standard Error and Standard Deviation?
The standard deviation (SD) of a set of data is the amount of variation or dispersion from its mean. A high standard deviation indicates that the data points are widely separated from the mean, whereas a low standard deviation indicates that the data points are relatively close to the mean.
The standard error of the mean (SEM) measures the sample mean’s deviation from the population mean. The standard error indicates how well the sample mean represents the true population mean and how much error is to be expected when sampling from the same population multiple times.
Conclusion
Understanding and using these measures correctly is critical for interpreting results, making valid inferences, and drawing reliable conclusions in a variety of fields of study. Standard errors, remember, provide valuable insights into the uncertainty associated with estimates, allowing researchers and analysts to make informed decisions and draw robust conclusions from their data.
Standard Error in Excel: Knowledge Hub
- Calculate Standard Error
- Find Standard Error of Estimate
- Find Residual Standard Error
- Calculate Standard Error of Proportion
- Calculate SEM
- How to Calculate Standard Error of Proportion in Excel

