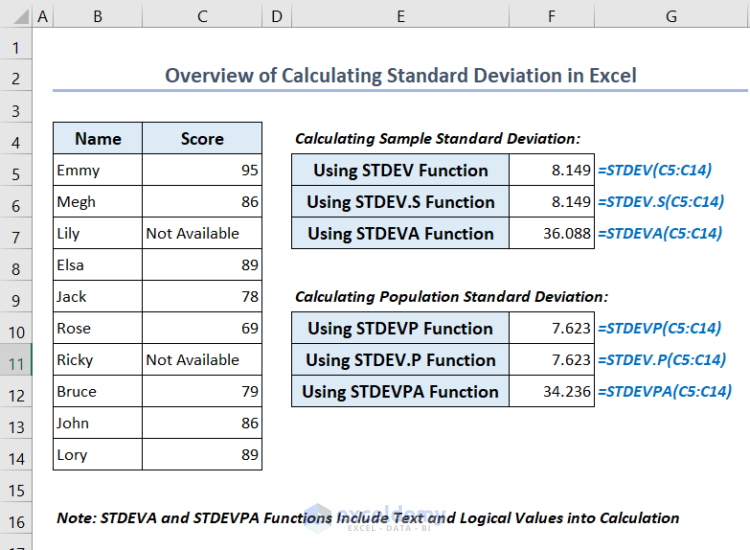
In this article, you’ll learn how to calculate standard deviation using formula in Excel. We’ll calculate both the sample standard deviation and the population standard deviation. For that purpose, we’ll use 6 built-in functions that are STDEV, STDEV.S, STDEVA, STDEVP, STDEV.P and STDEVPA functions.
You’ll also learn how to calculate variance using different formulas in Excel. Variance is the square of the standard deviation. We’ll calculate both the sample variance and the population variance. Here, we’ll also use 6 built-in functions that are VAR, VAR.S, VARA, VARP, VAR.P and VARPA functions.
In the last part of this article, you’ll see how to insert the standard deviation error bars in Excel. These bars will represent the standard deviation margin in a chart.
Standard deviation measures the variation of a dataset. You can compare similarities or dissimilarities of data using standard deviation in Excel.
We’ll use the Excel 365 version in this article. You can also use other versions of Excel for the same purpose.
Why Use Standard Deviation Formula in Excel?
You can use standard deviation formulas in Excel to calculate the standard deviation. Business analysts frequently utilize the standard deviation as an estimate for investment risk in reality. If the standard deviation is high, it’ll return a volatile result.
Download Practice Workbook
What is Standard Deviation in Excel?
The standard deviation measures how much the values of a set of data spread out from their average value. When the standard deviation is closer to zero, the data variability is lower. When the standard deviation is higher, there is more variation in the data.
There are 2 types of standard deviation calculation. Population standard deviation includes the entire contents of a data set. The sample standard deviation includes only an element or elements from the whole set. The population standard deviation is what a teacher will use to summarize the exam results of a class of students. We use the sample standard deviation to determine the average SAT score for a country.
What Are the Formulas for Sample and Population Standard Deviation and How do They Work?
Why Calculating Standard Deviation Is Useful in Excel?
- The standard deviation can give important information about how concentrated the data is. It displays whether or not a dataset’s numbers are dispersed or grouped together.
- A high standard deviation indicates that the data points are dispersed throughout a larger range. A low standard deviation indicates that the data points are all closer to the average.
- If you have to calculate the standard deviation manually, it might take a while. But you can do it fast and effectively by using the formulas in Excel.
- You can link your dataset to the functions to compute the standard deviation in Excel. So, when you change your data, the calculation changes automatically.
What Are the Uses of the Standard Deviation in Excel?
- Marketers use the standard deviation to predict the range of revenues they’ll get in the future.
- Weather forecasters use standard deviation to calculate the margin of error in their forecasts.
- Financial analysts use the standard deviation to analyze investments and portfolios.
- Other professionals like statisticians, market researchers, insurance analysts, teachers, and real estate agents use the standard deviation in their respective fields of work.
How Many Methods Are There to Calculate Standard Deviation Using Formula in Excel?
There are 2 methods to calculate standard deviation using formula in Excel. You can calculate the sample standard deviation using:
1. STDEV,
2. STDEV.S and
3. STDEVA functions.
You can determine the population standard deviation using:
1. STDEVP,
2. STDEV.P and
3. STDEVPA functions.
1. Calculate Sample Standard Deviation Using STDEV, STDEV.S and STDEVA Functions
Here, we calculate the sample standard deviation using the STDEV, STDEV.S and STDEVA functions.
- Write the following formulas into cells C16, C17 and C18 respectively:
=STDEV(C5:C14)=STDEV.S(C5:C14)=STDEVA(C5:C14)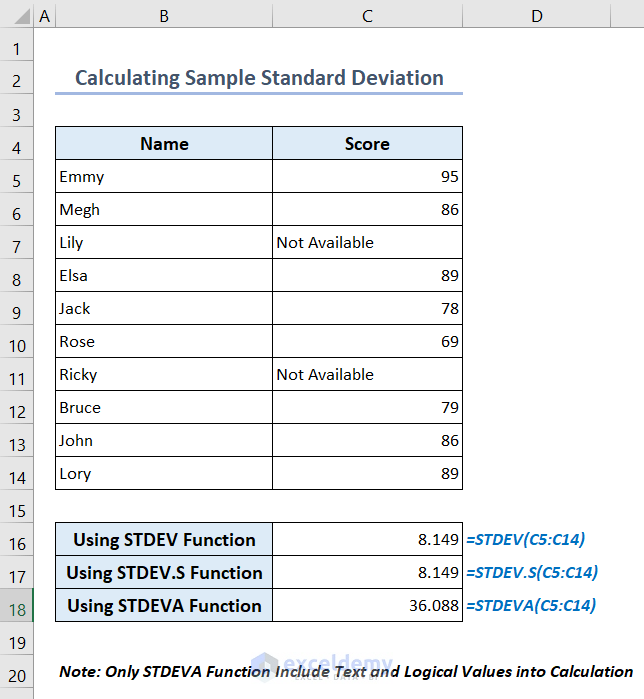
- The older versions of Excel still provide the out-of-date STDEV function only for backward compatibility. So, if you are using Excel 2010 and later you should use the STDEV.S function instead of the STDEV function.
- The STDEVA function includes text and logical values in the calculation. But the STDEV and STDEV.S functions exclude them. The STDEVA function takes FALSE as 0, and TRUE as 1. It takes textual values as 0.
- In Excel 2007 and later, the STDEV function can take up to 255 arguments. In Excel 2003, the function can take up to 30 arguments.
- The supplied arguments in the functions must contain at least two numeric values, otherwise, you’ll get the #DIV/0! error.
2. Calculate Population Standard Deviation Using STDEVP, STDEV.P and STDEVPA Functions?
Here, we calculate the population standard deviation using the STDEVP, STDEV.P and STDEVPA functions.
- Type the formulas into cells C16, C17 and C18 respectively:
=STDEVP(C5:C14)=STDEV.P(C5:C14)=STDEVPA(C5:C14)
- The STDEVP function is out of date. Therefore, you should use the STDEV.P function rather than the STDEVP function if you are using Excel 2010 or later.
- The STDEVPA function includes text and logical values in the calculation. However, the STDEVP or STDEV.P functions do not include them. The STDEVPA function takes FALSE as 0, and TRUE as 1. It takes textual values as 0.
Read More: Calculate Population Standard Deviation
Which Standard Deviation Function to Use in Excel?
How Many Methods Are There to Calculate Variance Using Formula in Excel?
There are 2 methods to calculate variance using formula in Excel. You can calculate the sample variance using:
1. VAR,
2. VAR.S and
3. VARA functions.
You can determine the population variance using:
1. VARP,
2. VAR.P and
3. VARPA functions.
1. Calculate Sample Variance Using VAR, VAR.S and VARA Functions?
Here, we calculate the sample variance using the VAR, VAR.S and VARA functions.
- Enter the formulas in cells C16, C17, and C18, accordingly:
=VAR(C5:C14)=VAR.S(C5:C14)=VARA(C5:C14)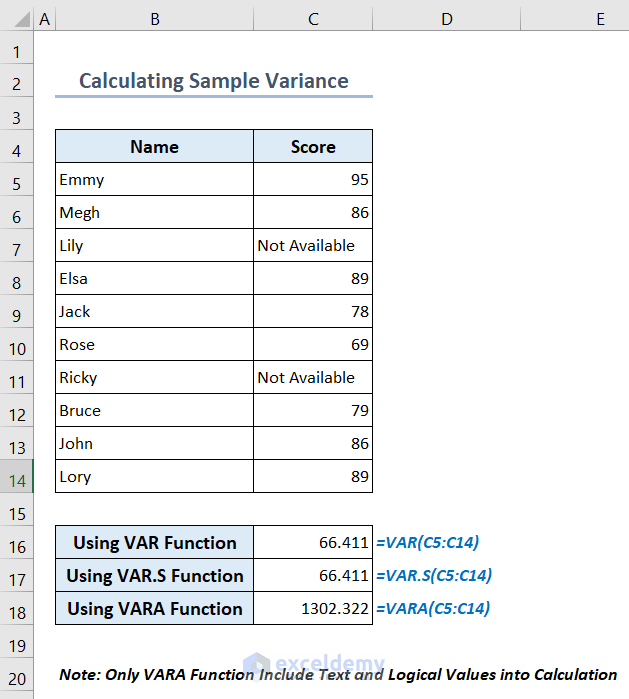
- Use the VAR.S function rather than the VAR function if you are using Excel 2010 or later.
- The VARA function’s calculation takes both textual and logical data into account. However, neither VAR nor VAR.S functions include them.
Read More: How to Calculate Mean and Standard Deviation in Excel
2. Calculate Population Variance Using VARP, VAR.P and VARPA Functions?
Here, we calculate the population variance using the VARP, VAR.P and VARPA functions.
- In cells C16, C17, and C18, respectively, enter the formulas:
=VARP(C5:C14)=VAR.P(C5:C14)=VARPA(C5:C14)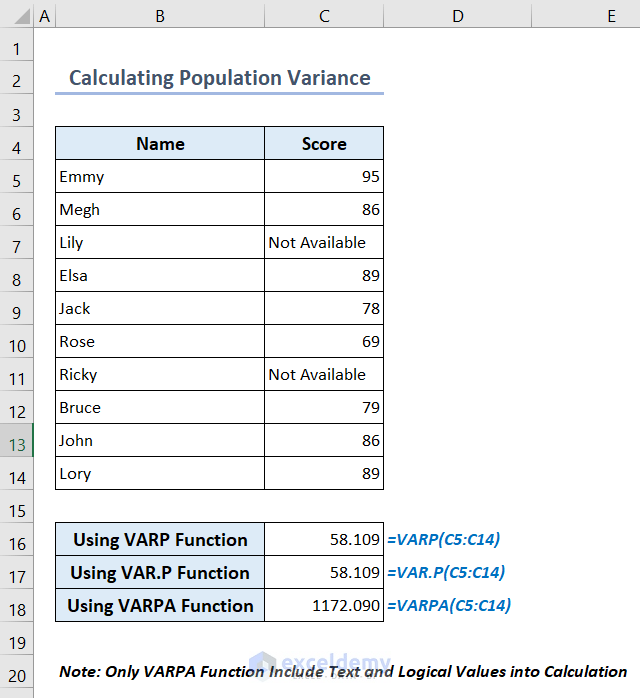
- If you are using Excel 2010 or later, use the VAR.P function instead of the VARP function.
- The calculation of the VARPA function considers both logical and textual data. However, the VARP or VAR.P functions do not include them.
Read More: How to Calculate Standard Deviation of a Frequency Distribution in Excel
How to Insert Standard Deviation Error Bars in Excel?
You can insert standard deviation error bars in Excel easily using a Line chart.
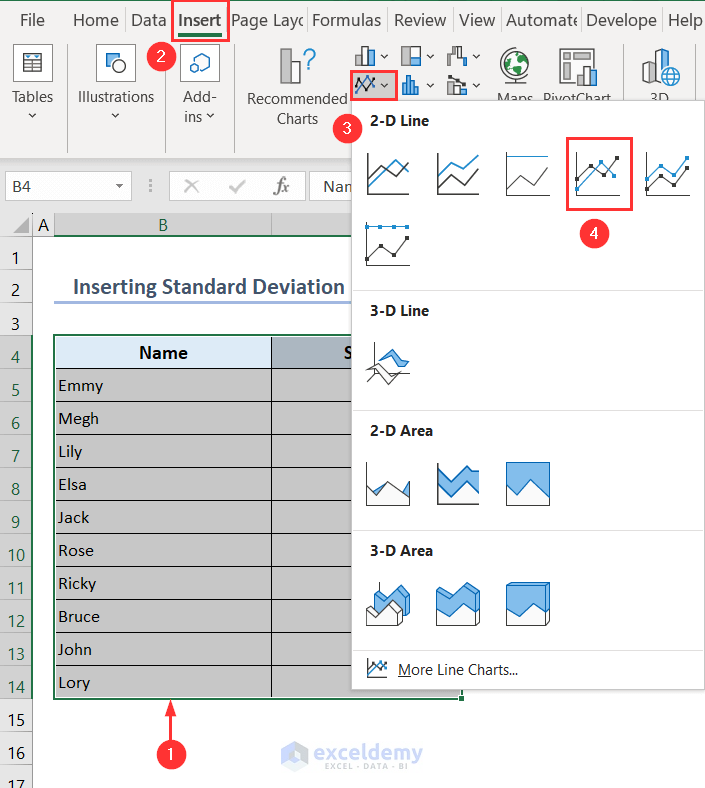
- Select the whole dataset and go to Insert > Insert Line or Area Chart.
- Choose the chart titled Line with Markers.
- You’ll see a line chart in your Excel sheet.
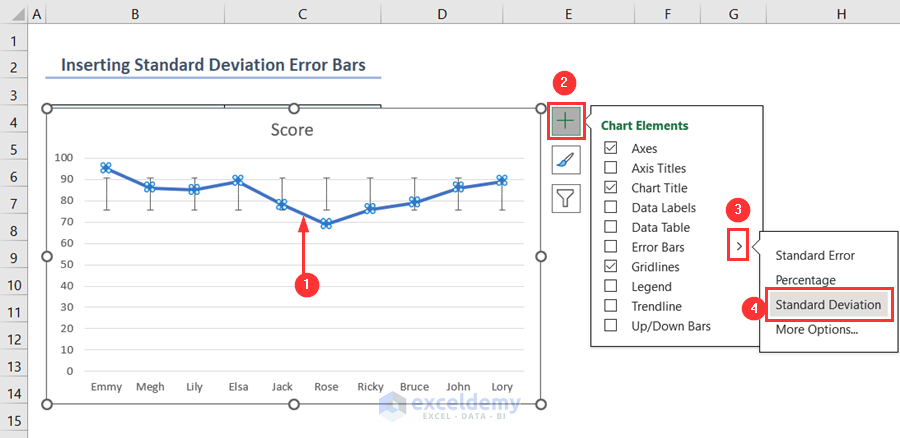
- Select the line on the chart and click on the plus icon beside the chart.
- You’ll find the Chart Elements pan. Select the pointer icon beside the Error Bars option.
- Then, choose Standard Deviation.
- Your chart now has the standard deviation error bars present.
Click the image for a detailed view
- We formatted the chart so that the standard deviation error bars look nice and tidy.
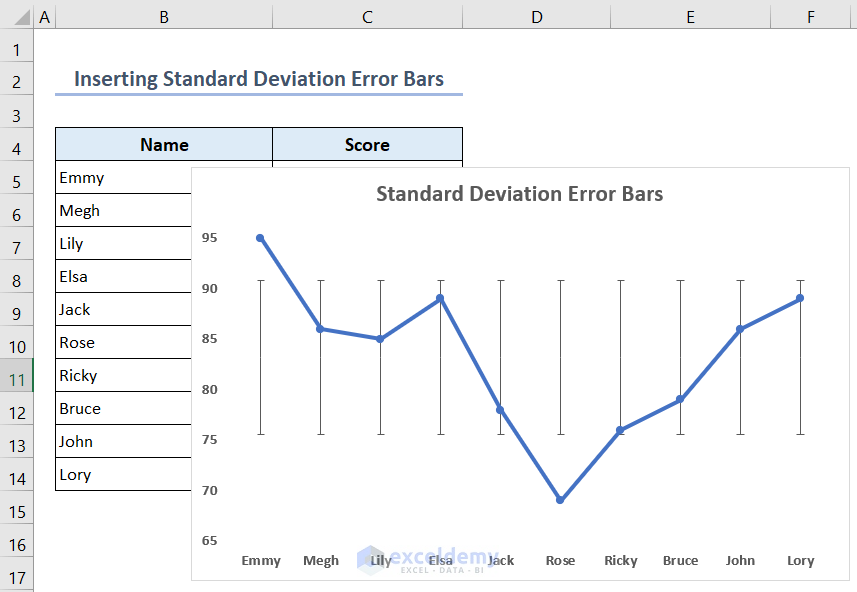
Click the image for a detailed view
Which Things You Have to Remember?
- The supplied arguments from a dataset must have at least two numerical values for the standard deviation formulas to function properly. Otherwise, you’ll see a #DIV/0! error.
- In Excel 2010 and later, use the STDEV.S function to determine the standard deviation of a sample.
- In Excel 2007 and earlier, use the STDEV function to determine the standard deviation of a sample.
- Use the STDEV.P function in Excel 2010 and later to determine the standard deviation of a population.
- Use the STDEVP function in Excel 2007 and previous, to determine the standard deviation of a population.
- Use the STDEVA function (sample standard deviation) or the STDEVPA function (population standard deviation) if you want to use logical or text values in the calculation.
Frequently Asked Questions
1. What are the thresholds for standard deviation?
Each standard deviation reflects a particular proportion of the data. It is called a normal distribution. The percentage representation of the data for each standard deviation is:
- One standard deviation reflects about 68% of the data.
- Two standard deviations reflect about 95% of the data.
- Three standard deviations reflect about 99.7% of the data.
2. Can you find a confidence interval in Excel?
Yes, you can find a confidence interval in Excel using the CONFIDENCE.T function. The syntax of the formula is:
=CONFIDENCE.T(alpha,standard_dev,size)
Here,
alpha is the significance level used to compute the confidence level. standard_dev is the standard deviation and size is the sample size of the data.
3. Should I use STDEV.S or STDEV.P in Excel?
Answer: When you are calculating the standard deviation of a sample you should use the STDEV.S function. But when you are using an entire population as your dataset then you should use the STDEV.P function.
4. Which standard deviation is better?
Answer: A low standard deviation implies that the data are grouped around the mean, whereas a large standard deviation shows that the data are more dispersed. In contrast, a high or low standard deviation indicates that the data points are, respectively, above or below the mean. A standard deviation that is close to zero implies that the data points are close to the mean. So, low standard deviation is better.
5. What is the difference between standard deviation and variance?
Answer: The standard deviation calculates the variance of the data set’s numbers. In contrast, variance assigns an exact value to how far the data set’s numbers deviate from the mean.
Conclusion
In conclusion, you have learned to calculate standard deviation using formula for both population and sample data in Excel through this article. For this, we use the STDEV, STDEV.S, STDEVA, STDEVP, STDEV.P and STDEVPA functions. You can calculate variance using the VAR, VAR.S, VARA, VARP, VAR.P and VARPA functions in Excel. You can insert the standard deviation error bars also. In a variety of disciplines, including business and statistics, these computations are crucial for data analysis and risk assessment. When you examine a complete dataset, you can use the population standard deviation. When only a subset of the population is available, you can use the sample standard deviation.
Standard Deviation Formula in Excel: Knowledge Hub
- Calculate Standard Deviation with IF Conditions
- Calculate Percentile from Mean and Standard Deviation
- How to Calculate Uncertainty in Excel
- How to Calculate Standard Deviation of y Intercept in Excel

