In this Excel tutorial, you will learn the topic of Excel Probability Distribution. We will guide you on how you can calculate probability distribution with easy steps. You will also learn probabilities like Discrete, Normal and many more.
While writing this article, I have used Microsoft 365. However, you can use any suitable version of Excel to perform these distributions.
Whether you are a data analyst or a statistics student, learning about probability distributions must help. Many fields, such as finance, insurance and scientific research, apply probability distribution daily. Probability distributions are essential for making decisions, analyzing trends, and predicting outcomes.
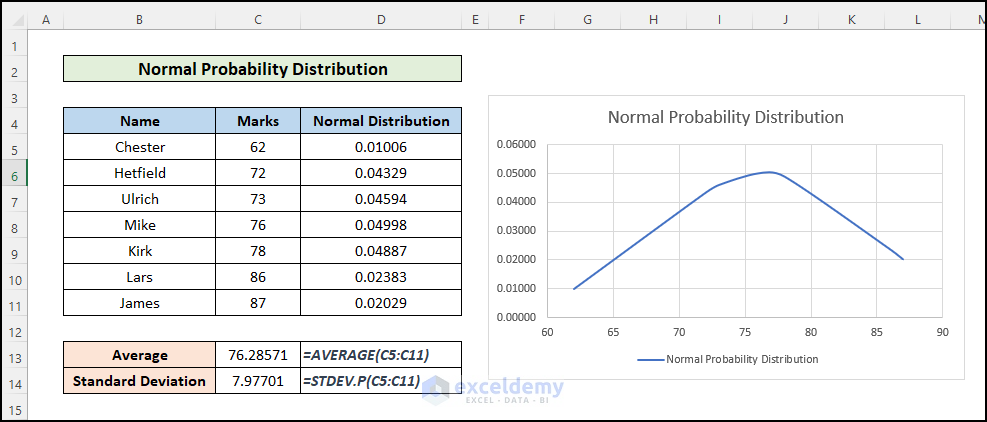
In the overview image below, you can see that we have calculated the mean, standard deviation and normal distribution. We have also plotted the normal distribution in a graph.
You can click the image to get a better view
Download Practice Workbook
What Do You Mean by Probability Distribution?
A probability distribution is a statistical concept. In Excel, we use it to model and analyze the occurrence of various outcomes within a given data set or experiment. Excel offers a range of built-in functions and tools designed to handle specific probability distributions, such as the normal, binomial, and Poisson distributions. These tools help us determine the chances of certain events, generate random numbers, and do statistical analysis.
Some of the most used probability distributions and functions are given below.
- Normal: NORMDIST, NORMINV
- Standard Normal: NORMSDIST, NORMSINV
- Binomial: BINOMDIST, CRITBINOM
- Negative Binomial: NEGBINOMDIST
- Poisson: POISSON
How to Calculate Probability Distribution in Excel with Easy Steps?
You will learn a step-by-step process to calculate probability distributions. Here, we will take three easy steps to determine probability distributions. Please follow the context below.
1. Calculate Probability for Each Event
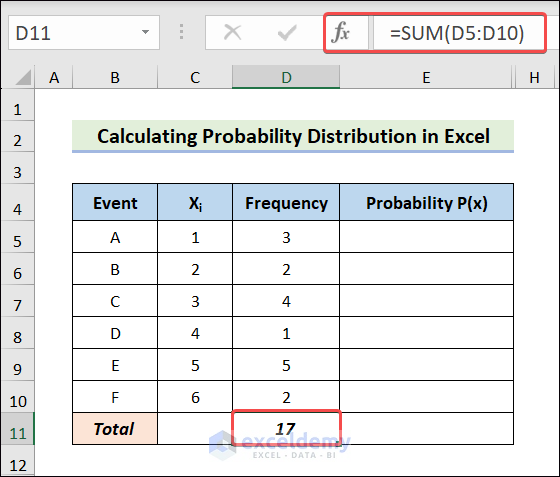
In the first step, we will calculate the total frequency using the SUM function. Later, we can determine the probability of each event using a formula.
Select cell D11 >> insert the following formula >> hit Enter.
=SUM(D5:D10)
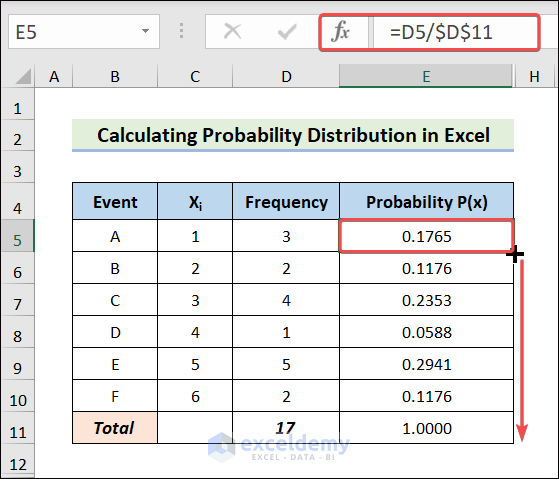
Choose cell E5 >> apply the below formula >> drag the Fill Handle icon to E11.
=D5/$D$11
2. Determine Mean of Probability Distribution
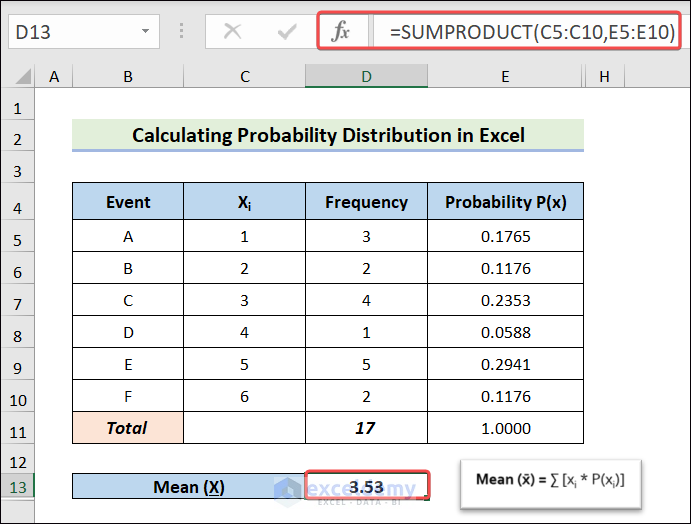
Now, we will determine the Mean using the SUMPRODUCT function.
- To begin, select the D13 cell.
- After that, insert the equation below and hit Enter.
=SUMPRODUCT(C5:C10,E5:E10)
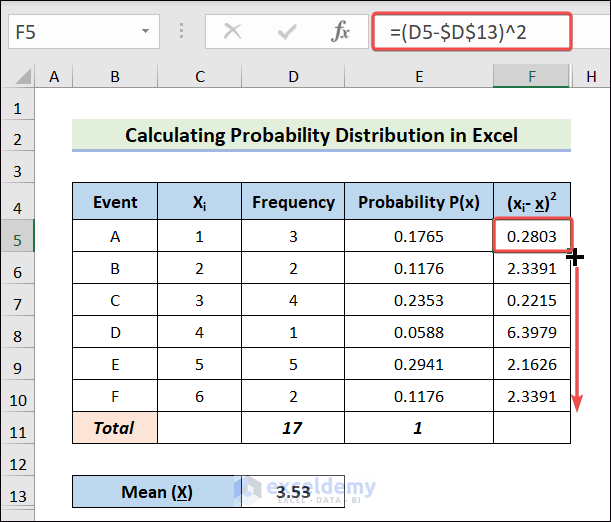
3. Find Standard Deviation of Probability Distribution
In the last section, you will learn to calculate the Standard Deviation. We must use several Excel Formulas, the SUM function and the SQRT function.
Select cell F5 >> apply the below formula >> drag the Fill Handle icon to F10.
=(D5-$D$13)^2
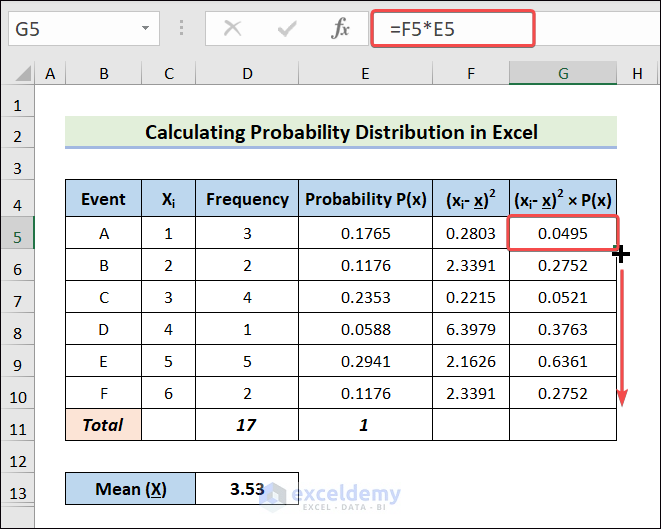
Select cell G5 >> apply the below formula >> drag the Fill Handle icon to G10.
=F5*E5
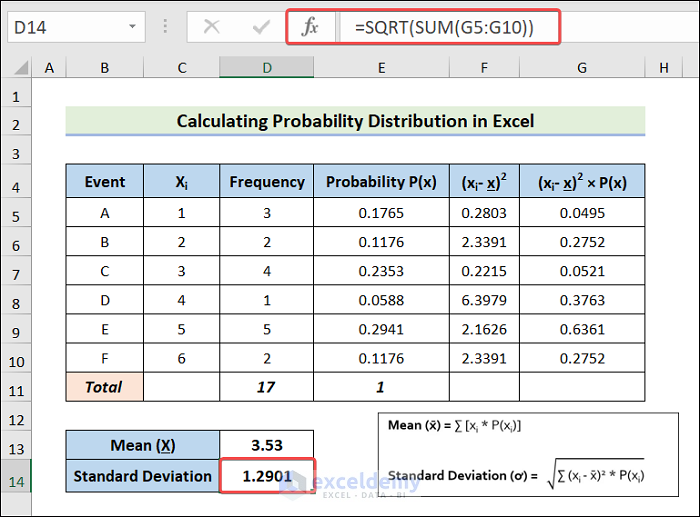
Choose D15 >> input the below equation >> hit Enter.
=SQRT(SUM(G5:G10))
How Many Methods Available to Find Discrete Probability Distribution?
A discrete probability distribution shows the chances of specific, separate outcomes in a random event.
Several methods are available to find the probability distribution of a discrete random variable. However, we will present two ways of determining discrete probability distribution in Excel. You will learn these methods throughout the following context.
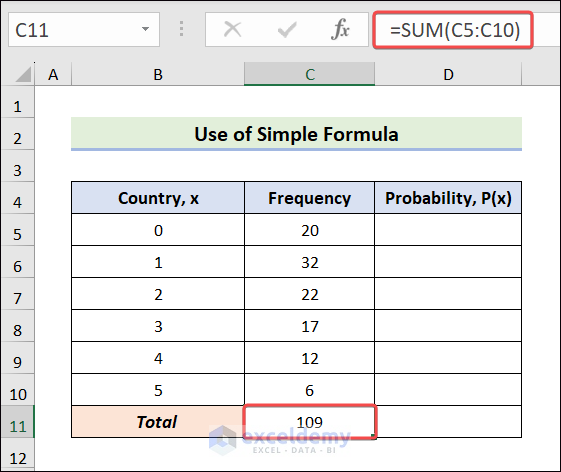
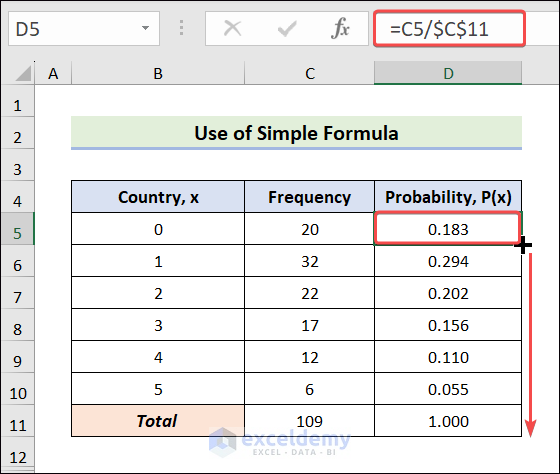
1. Implement a Formula to Find Discrete Probability Distribution
We can implement a formula to find out the probability of each event. As previously, we will also calculate the mean and standard deviation with the help of SUM and SQRT functions.
Choose C11 >> insert the below formula >> hit Enter.
=SUM(C5:C10)
Again, select cell D5 >> apply the following formula >> drag the Fill Handle icon to D11.
=C5/$C$11
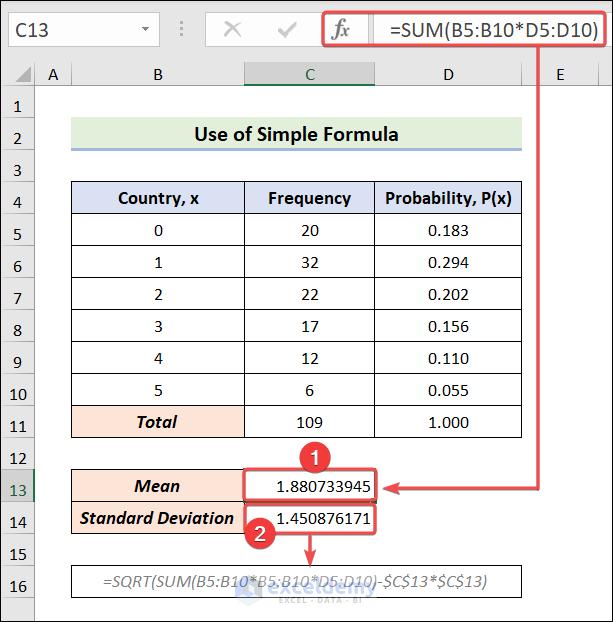
Select C13 >> input the following formula >> hit Enter.
=SUM(B5:B10*D5:D10)
Choose C14 >> input the below formula>> hit Enter.
=SQRT(SUM(B5:B10*B5:B10*D5:D10)-$C$13*$C$13)
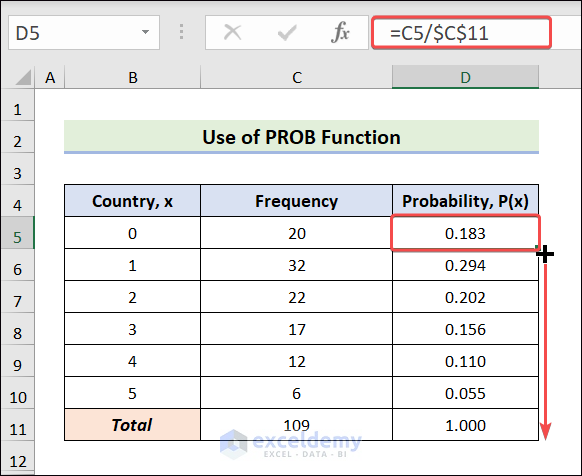
2. Use PROB Function to Determine Discrete Probability Distribution
We can calculate the probability of a partial event directly using the PROB function. To help you understand better, we will determine the probability of visiting the first three countries.
Select C11 >> input the below formula >> hit Enter.
=SUM(C5:C10)

Choose D5 >> insert the following formula >> drag the Fill Handle icon to D11.
=C5/$C$11
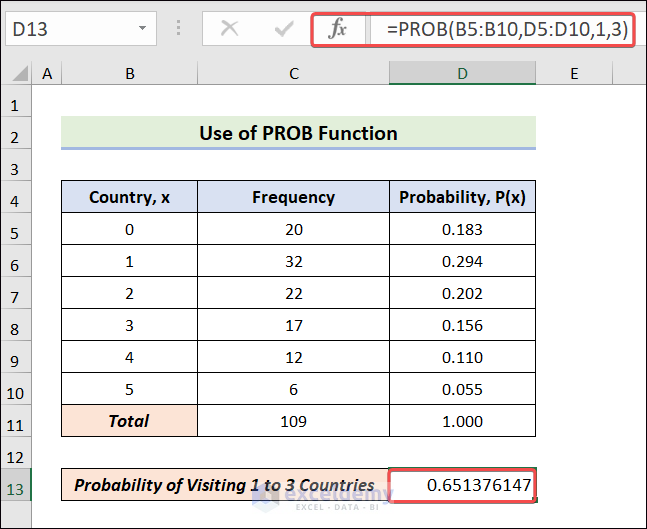
Now, select D13 >> apply the formula below.
=PROB(B5:B10,D5:D10,1,3)
Can You Show Some Examples of Calculating Normal Distribution?
Yes! Let’s get started.
The Normal Probability Distribution is also known as the Gaussian or Bell Curve. It is a continuous statistical model that describes data distribution where values cluster around a central mean. In the following context, you will see three examples.
1. Determine Probability Less Than Defined Value
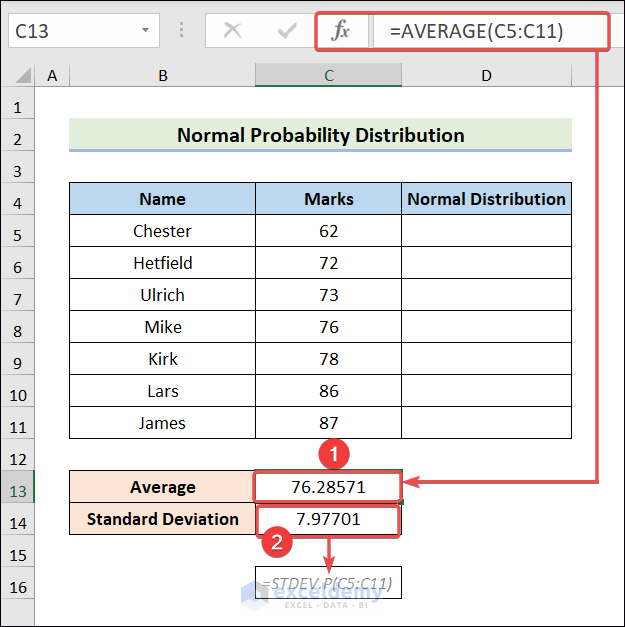
Here, we will use the mean and standard deviation using the AVERAGE and STDEV.P functions. After that, we will use the normal distribution for each person with the help of the NORM.DIST functions. Lastly, we will calculate the probability of marks less than 60.
Select C13 >> input the below formula >> hit Enter.
=AVERAGE(C5:C11)
Select C14 >> insert the following formula >> hit Enter.
=STDEV.P(C5:C11)
Choose cell D5 >> apply the formula below >> drag the Fill Handle icon to D11.
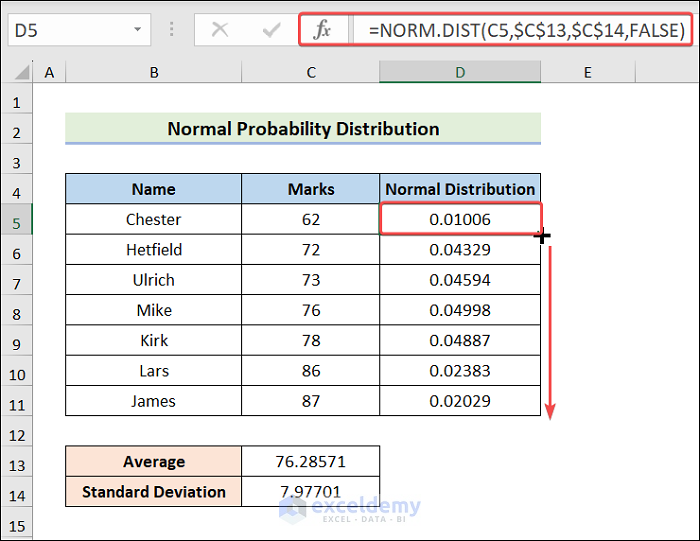
=NORM.DIST(C5,$C$13,$C$14,FALSE)
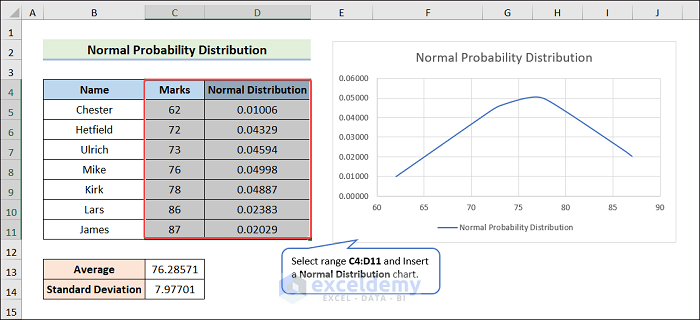
Select C4:D11 range >> insert a Scatter chart.
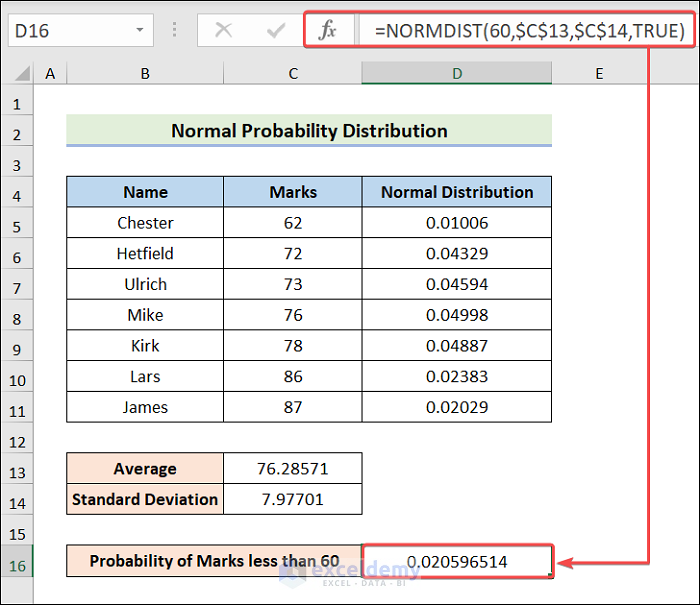
Select cell D16 >> insert the following equation >> hit Enter.
=NORMDIST(60,$C$13,$C$14,TRUE)
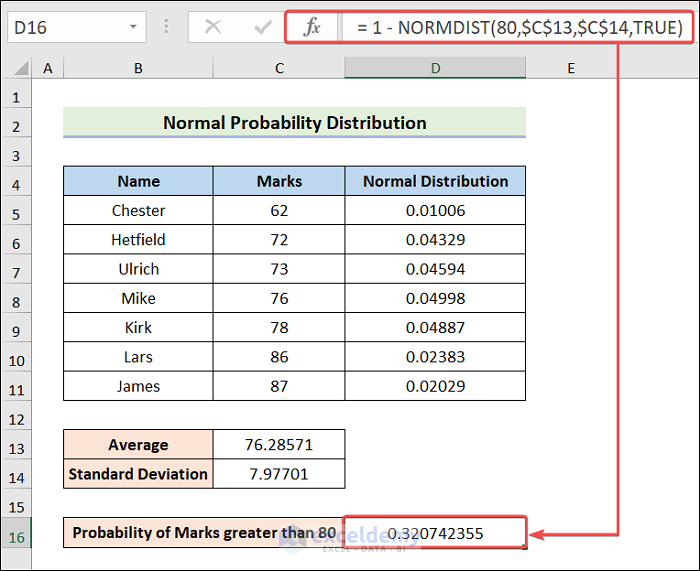
2. Calculate Probability Greater Than Defined Value
Throughout this example, we will determine the probability of marks greater than 80.
- As previously, calculate the Average and Standard Deviation.
- Choose D16 >> insert the following equation >> hit Enter.
= 1 - NORMDIST(80,$C$13,$C$14,TRUE)
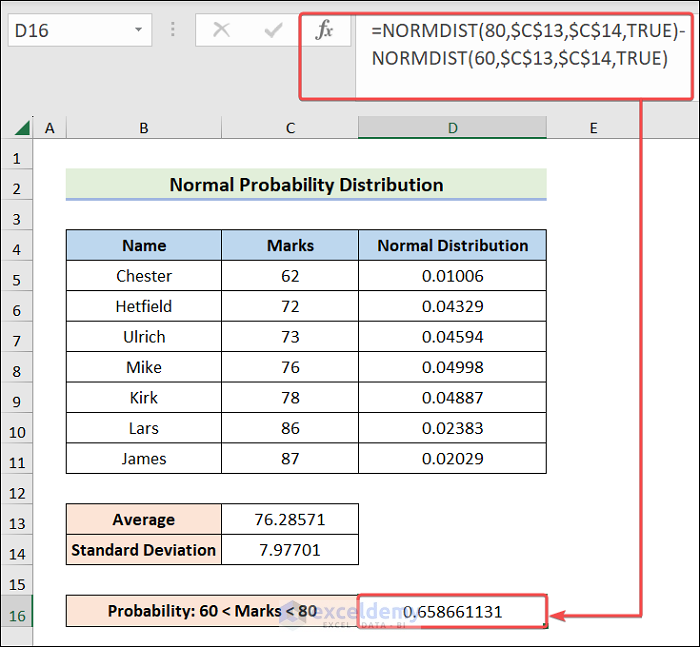
3. Find Out Probability Between Two Values
In the last example, we will determine the probability of marks between 60 and 80.
- Likewise, determine the Average and Standard Deviation.
- Choose D16 >> input the following formula >> hit Enter.
=NORMDIST(80,$C$13,$C$14,TRUE)-NORMDIST(60,$C$13,$C$14,TRUE)
What Other Types of Probability Distributions Does Excel Offer?
Excel also provides many more functions for the following advanced distributions.
- Weibull: WEIBULL
- T-Distribution: TDIST, TINV
- Chi-Square: CHIDIST, CHIINV
- Lognormal: LOGNORMDIST, LOGINV
- Hypergeometric: HYPGEOMDIST
- Beta: BETADIST, BETAINV
- Gamma: GAMMADIST, GAMMAINV
- F-Distribution: FDIST, FINV
- Exponential: EXPONDIST
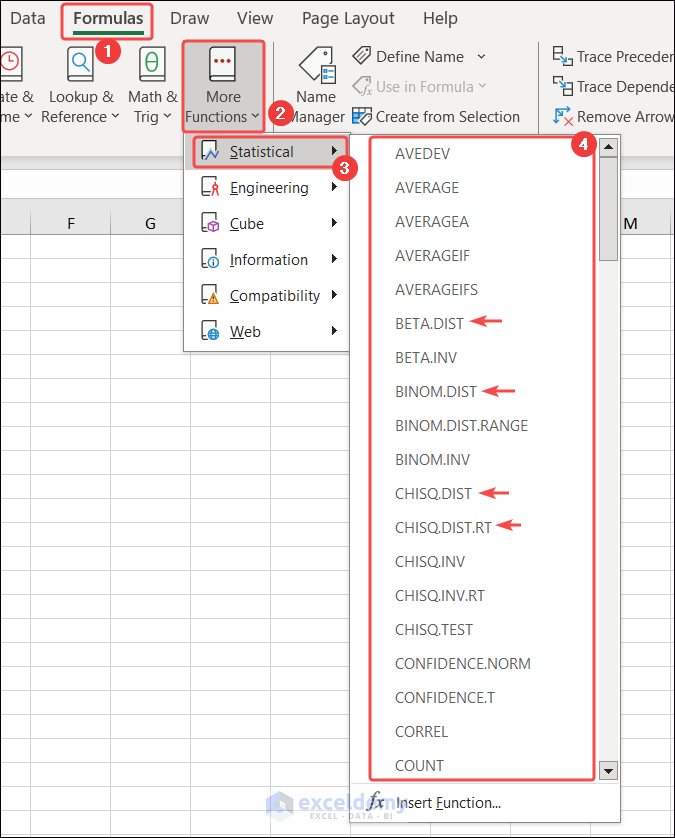
We can easily find these mentioned functions to perform the desired probability distribution in Excel.
- To begin, navigate to the Formulas tab.
- Expand More Functions followed by Statistical.
As a result, we will see a list of Statistical Functions.
How to Generate Random Numbers from a Probability Distribution?
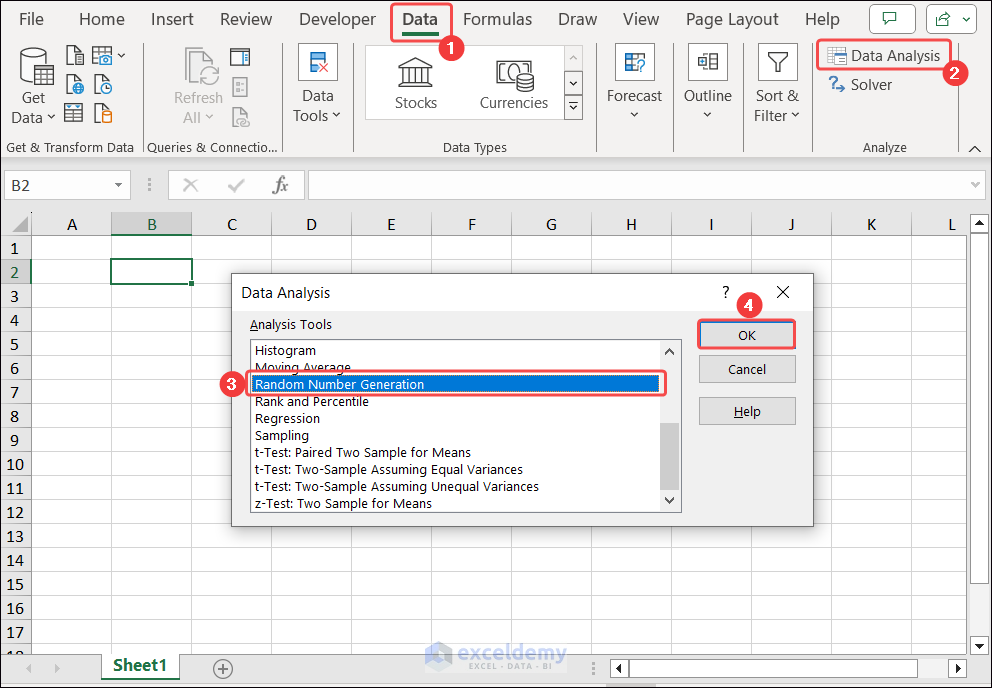
We can generate many random numbers for a given distribution. Please follow the instructions below.
- First, go to the Data tab and click on Data Analysis.
Due to this, the Data Analysis tool will appear.
- Choose Random Number Generation and hit OK.
Click the image to get a better view
As a result, the Random Number Generation window will open.
- Input the Number of Variables and the Number of Random Numbers.
- Choose the desired distribution from the drop-down and hit OK.
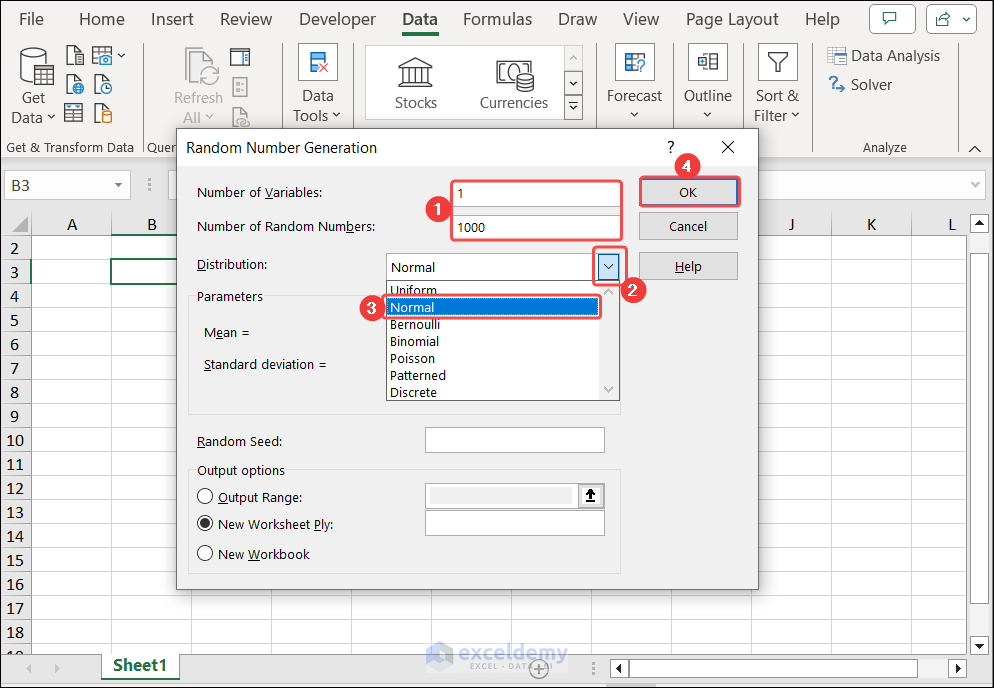
You can click the image to get a better view
Which Things You Should Keep in Mind?
While going through this article, you should keep several things in mind.
- The mean is the average of data, and the standard deviation must be positive.
- You must have our Excel file side by side because you’ll have to follow numerous calculations.
- When calculating probabilities between two values, you must subtract the chances of the smaller value from the greater one.
Frequently Asked Questions
1. What does probability distribution mean in Excel?
Answer: The probability distribution is a mathematical way to calculate the chances of various outcomes occurring in a dataset. It provides an essential outline for understanding the probabilities associated with numerous events.
2. What is the formula for probability distribution?
Answer: Depending on the types of distribution, there are different probability distribution formulas. For example, the NORM.DIST function represents the normal distribution. We can use BINOM.DIST for the binomial distribution.
3. How do you find the probability distribution in Excel?
Answer: First, you must choose an Excel function based on your distribution type. Assume you want to calculate normal probability distribution. For a normal distribution, you can use the NORM.DIST function. Later, you must input the required values like mean and standard deviation.
Conclusion
Hopefully, the article will help you with everything you need about Probability Distribution in Excel. Use built-in statistical functions to calculate various types of probabilities. If required, you can generate random samples with the help of the Generate Random Number feature for a particular distribution. Do not forget to leave a comment or suggestions.
Excel Probability Distribution: Knowledge Hub
- Calculate Probability Distribution
- Find Discrete Probability Distribution
- Exponential Probability Distribution in Excel
- Calculate Probability of Hypergeometric Distribution
- Normal Probability Distribution in Excel
- Poisson Probability Distribution
- Model Uniform Probability Distribution
- Use Continuous Probability Distribution
- Calculate Variance of Probability Distribution
- Find Standard Deviation of Probability Distribution
<< Go Back to Excel Probability | Excel for Statistics | Learn Excel

