Z score is a measurement that indicates the relationship of a datapoint to the mean of the dataset. It calculates the number of standard deviations by which data points differ from the mean. Z score is used to determine the relative positions of data points in a dataset. It is useful to calculate probability, outliers, etc. that help in taking calculated risks and making important decisions.
In this article, we will explore how to calculate the Z score in Excel. We will explain three methods to find the Z score which are using functions, using the Formulas tab, and without helper columns.

Download Practice Workbook
Download this practice workbook while reading this article.
How to Find Z Score in Excel
1. Using AVERAGE and STDEVPA Functions
- Select cell G4 and write the following formula using the AVERAGE function to determine the average.
=AVERAGE(C5:C12)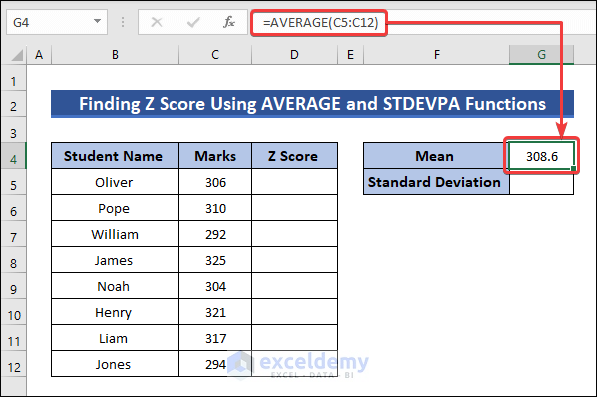
- Then calculate the standard deviation by applying the following formula with the STDEVPA function in cell G5.
=STDEVPA(C5:C12)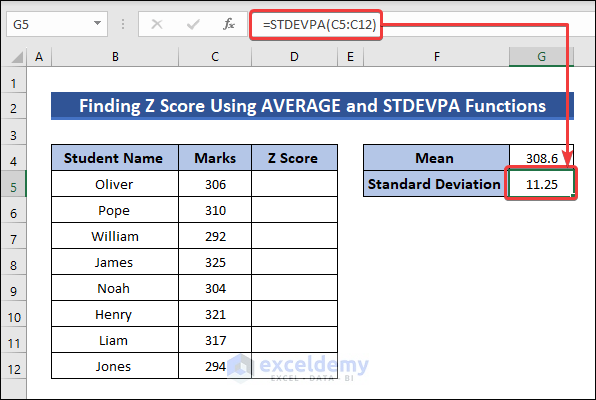
- Then use the formula below to find the Z score of the value in cell C5.
=(C5-$G$4)/$G$5- Finally, Autofill the rest of the cells to get the Z score for all data.

2. Using Formulas Tab
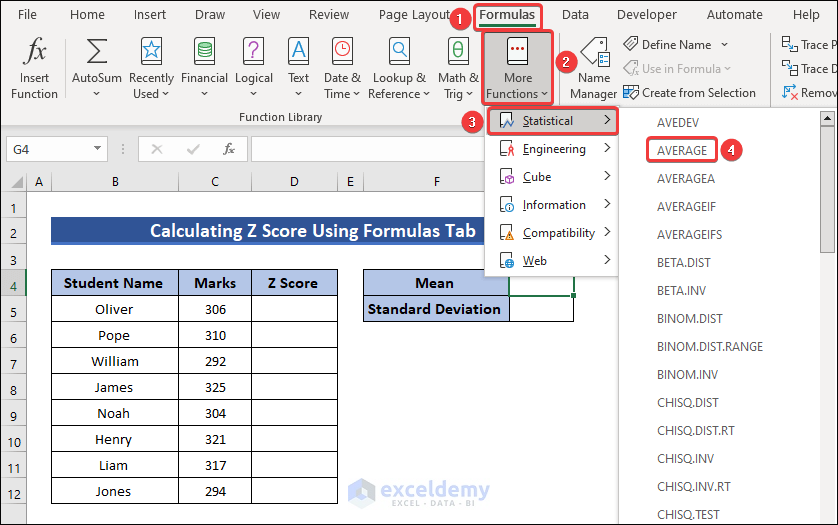
- Select cell G4 and go to,
Formulas → More Functions → Statistical → AVERAGE
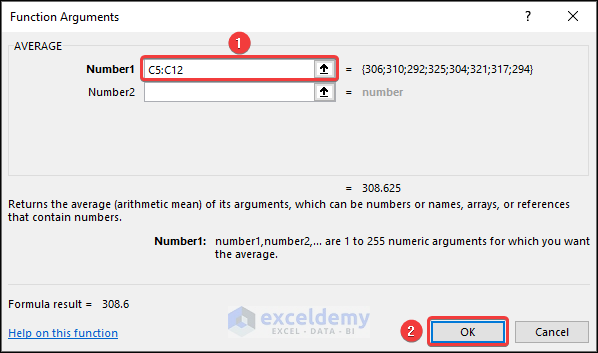
- The Function Arguments dialogue box will appear. Insert the range C5:C12 and click OK to get the average cell G4.
- Similarly, select cell G5 and go to, Formulas → More Functions → Statistical → STDEVPA.
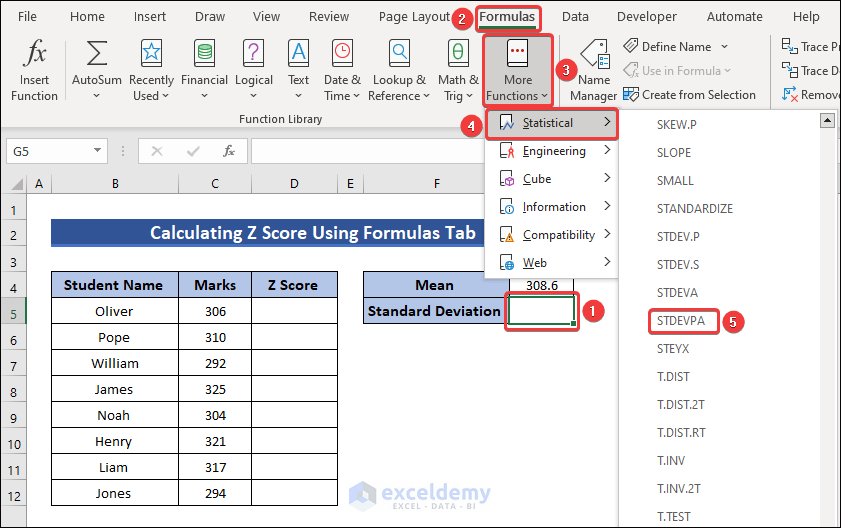
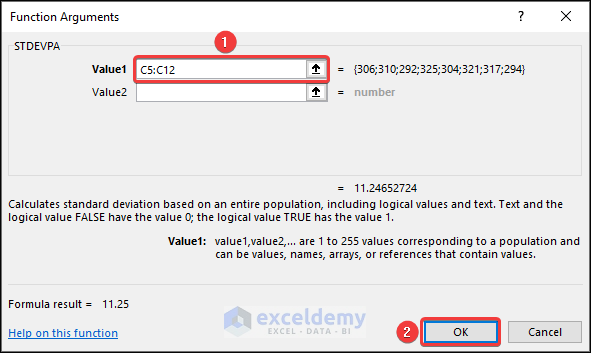
- In the Function Arguments box, select the range C5:C12 in Value1 and press OK to determine the standard deviation.
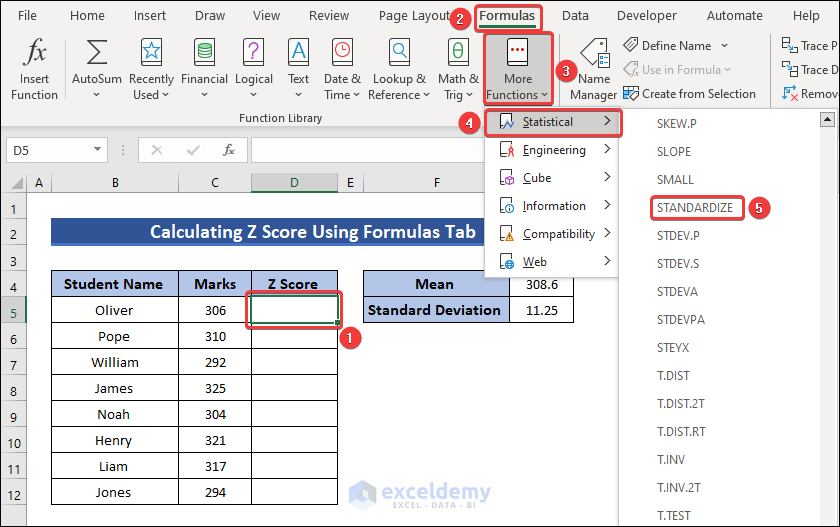
- Now select cell D5 and navigate to,
Formulas → More Functions → Statistical → STANDARDIZE
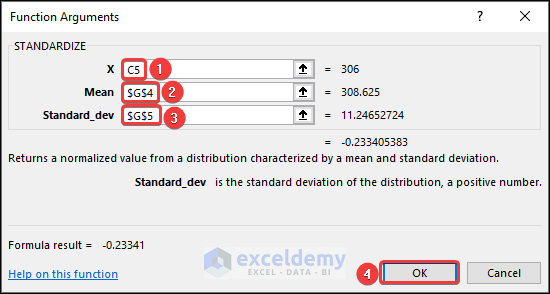
- In the Function Arguments dialogue, select cell C5 as the value of X.
- Then insert $G$4 as the Mean and $G$5 as the Standard_dev.
- Click on OK to get the Z score.
- Finally, Autofill D6 to D12 to get Z scores for all the values.
3. Without Helper Cells
In this example, we will use the STDEV.S and STEV.P functions to calculate the Z score.
- Select cell D5 and insert the following formula to find the Z score using the S function.
=(C5-AVERAGE($C$5:$C$12))/STDEV.S($C$5:$C$12)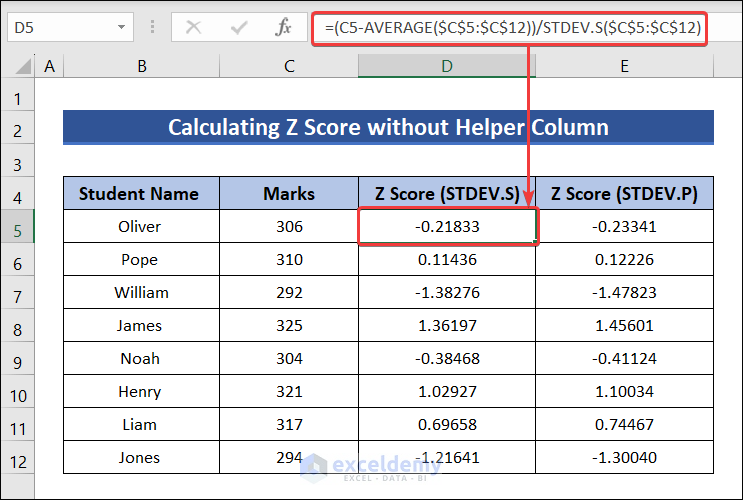
- Similarly, click on cell E5 and type the formula given below to determine the Z score using the STDEV.P function.
=(C5-AVERAGE($C$5:$C$12))/STDEV.P($C$5:$C$12)
Frequently Asked Questions (FAQs)
1. Can we do Z test in Excel?
Z test in Excel can easily be done using the ZTEST function. The ZTEST function takes an array of data and an X value as arguments. It returns the one-tailed probability associated with the Z test.
2. What does z-score tell us?
The Z score of a data point tells us how many standard deviations the value is away from the mean of the whole dataset. It is useful to compare various data points in a dataset.
3. Is there a ZSCORE function in Excel?
Unfortunately, there is no ZSCORE function in Excel. Although it can be created using the VBA code. Besides, Z score can easily be calculated using the AVERAGE and STDEVPA functions as explained above.
Things to Remember
- If you are working with the entire dataset of the population, use the P function.
- If you are working with a sample of a dataset, use the S function.
- Verify if your data is normally distributed as the Z score assumes that data follows a normal distribution.
Conclusion
Thanks for making it this far. I hope you found this article useful. In this article, we have described three methods on how to calculate Z score in Excel. We have used the AVERAGE and STDEV functions, the Formulas tab to find the Z score. We have also determined the Z score without helper columns. If you have any queries or recommendations regarding this article, feel free to let us know in the comment section below.
Z Score in Excel: Knowledge Hub
- Calculate Z Score
- Calculate Critical Z Score
- Calculate Altman Z Score
- Calculate BMI Z Score
- Calculate Probability from Z-Score
- Calculate P Value From Z Score
- Find Outliers Using Z Score
<< Go Back to Statistical Significance in Excel | Excel for Statistics | Learn Excel

