In this article, we have shown you the step-by-step process to create an Excel Area Chart. We have discussed the Stacked Area Chart and 100% Stacked Area Chart. We have explored the steps to create Excel Area Chart in 2-D and 3-D formats.
Excel Area Charts are very useful for data comparison and visualizing trends. These charts are flexible, easy to understand and customizable.
Overall, Excel Area Charts can help us in data analysis, presentation and making decisions depending on data points.
Download Practice Workbook
You can download this practice workbook while going through the article.
How to Create an Excel Area Chart
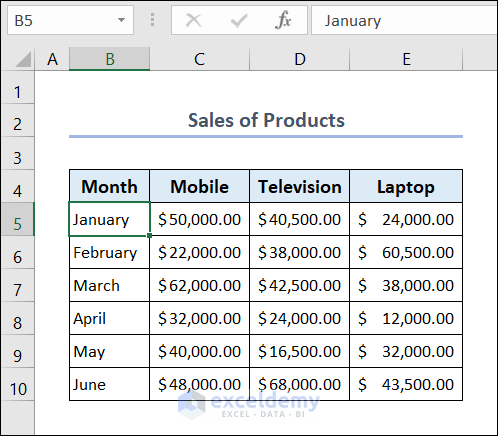
We will use the following dataset to create a basic Excel Area Chart.
- Select range B4:E10 >> go to the Insert tab >> select Area Chart from the Charts group >> select an Area Chart.
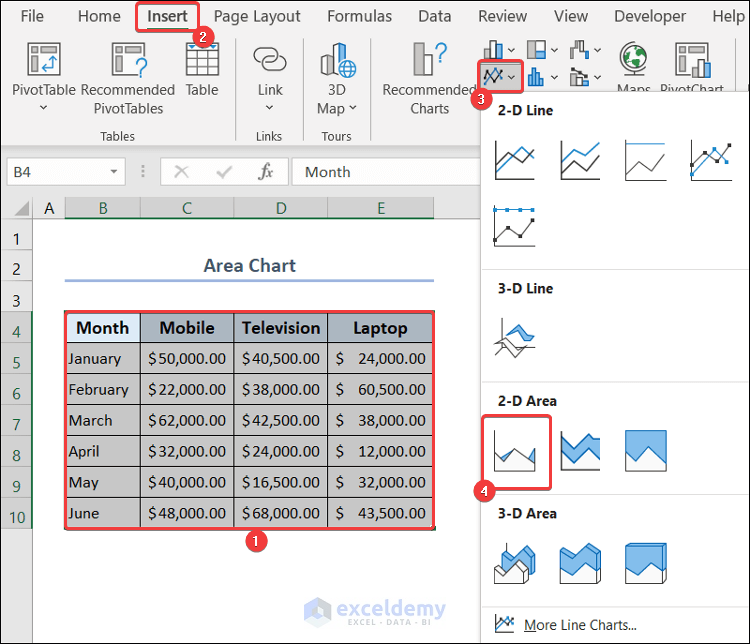
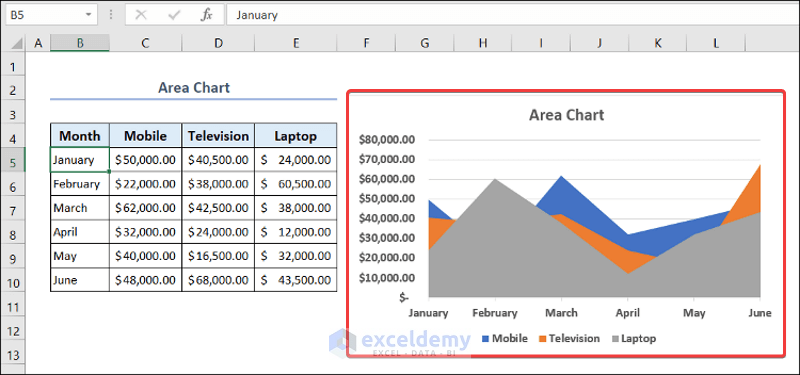
- You will see the Area Chart in your worksheet.
Excel Area Charts: 2-D Area Charts
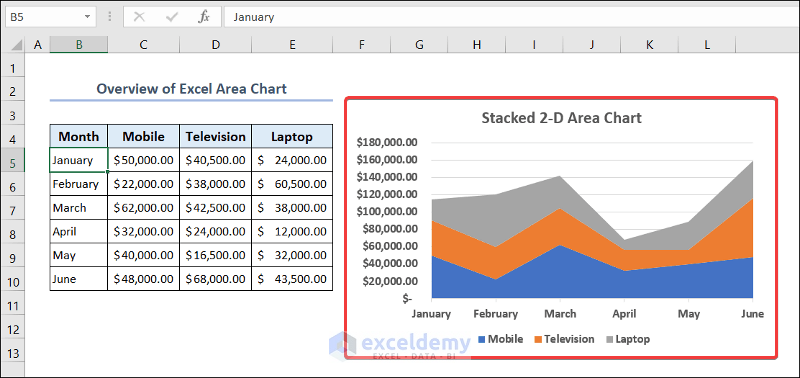
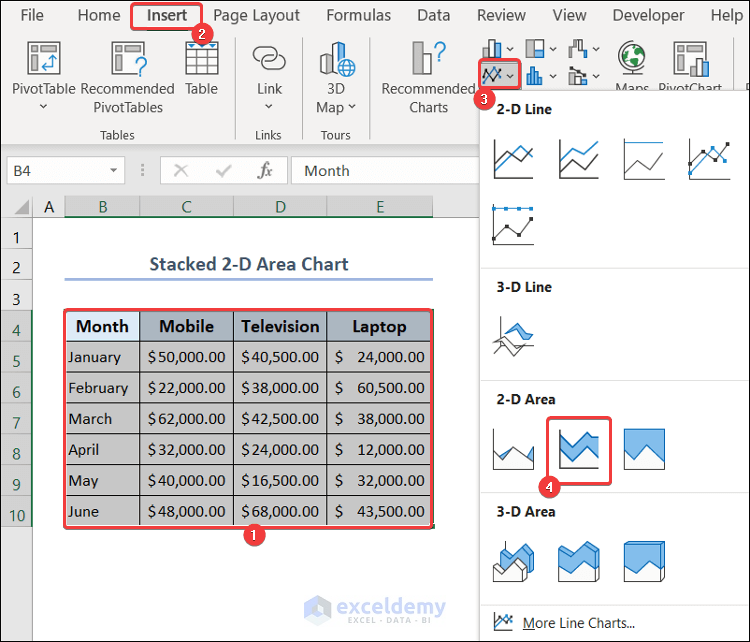
1. Stacked 2-D Area Chart
- Select range B4:E10 >> go to the Insert tab >> select Area Chart from the Charts group >> select Stacked 2-D Area Chart.
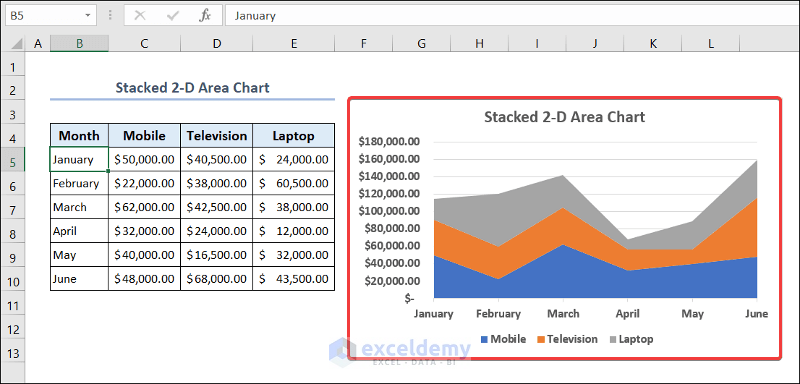
- You will see the Stacked 2-D Area Chart in your worksheet.
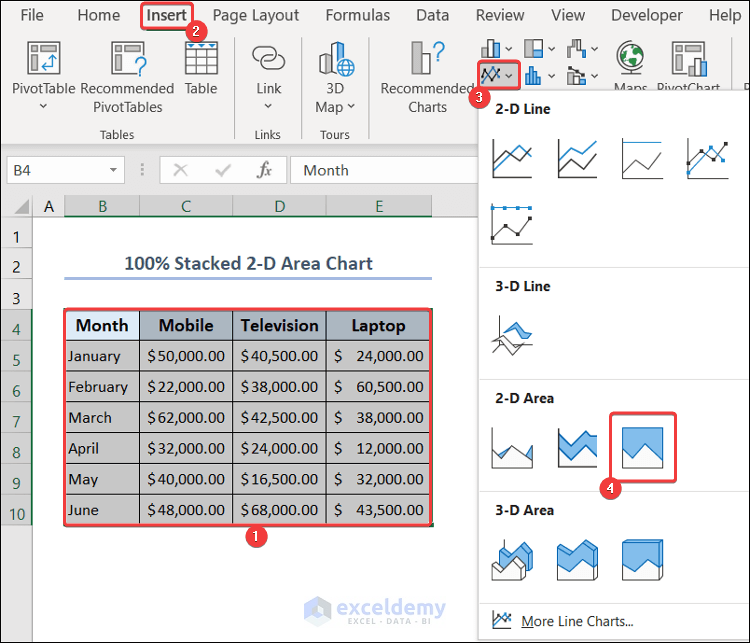
2. 100% Stacked 2-D Area Chart
- Select range B4:E10 >> go to the Insert tab >> select Area Chart from the Charts group >> select 100% Stacked 2-D Area Chart.
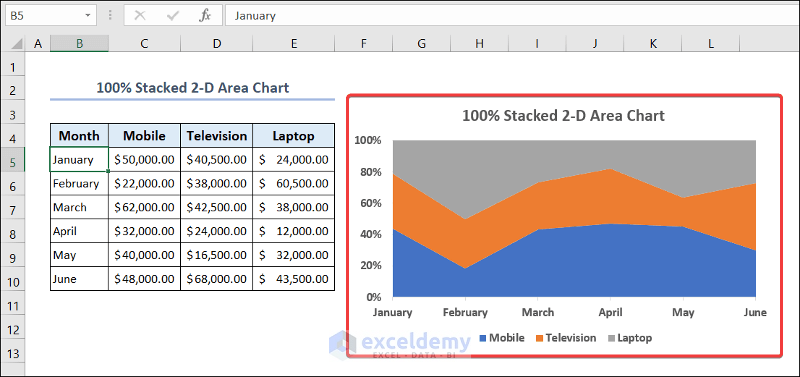
- You will see the 100% Stacked 2-D Area Chart in your worksheet.
Excel Area Charts: 3-D Area Charts
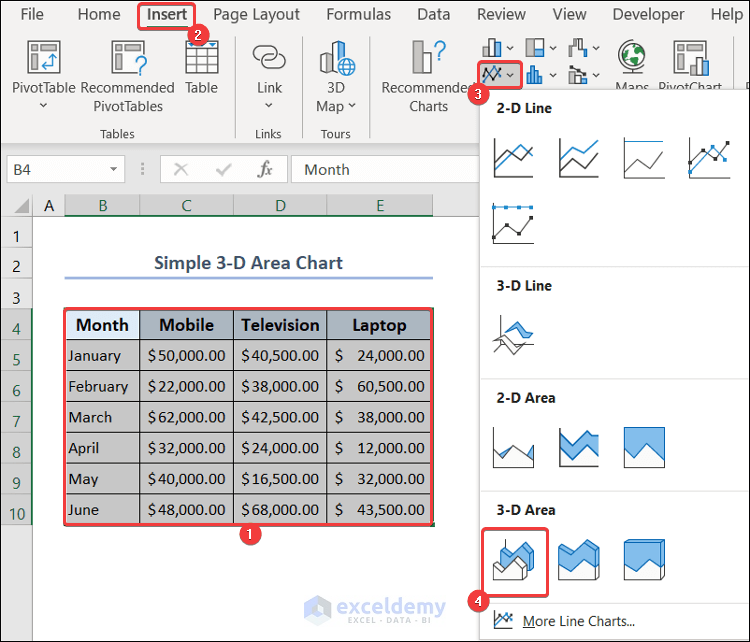
1. Simple 3-D Area Chart
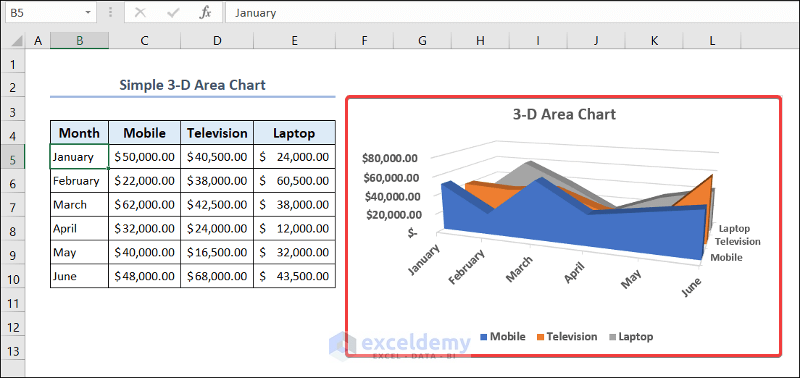
- Select range B4:E10 >> go to the Insert tab >> select Area Chart from the Charts group >> select 3-D Area Chart.
- You will see the 3-D Area Chart in your worksheet.
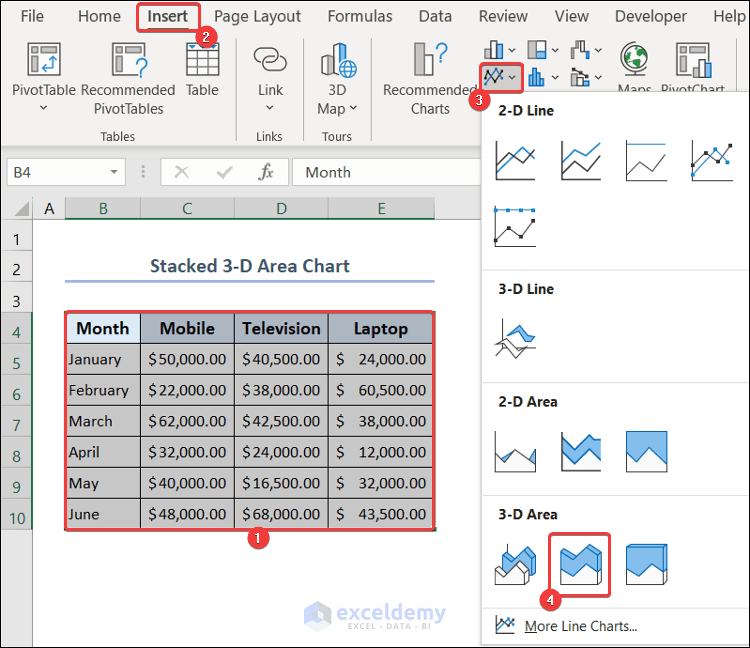
2. Stacked 3-D Area Chart
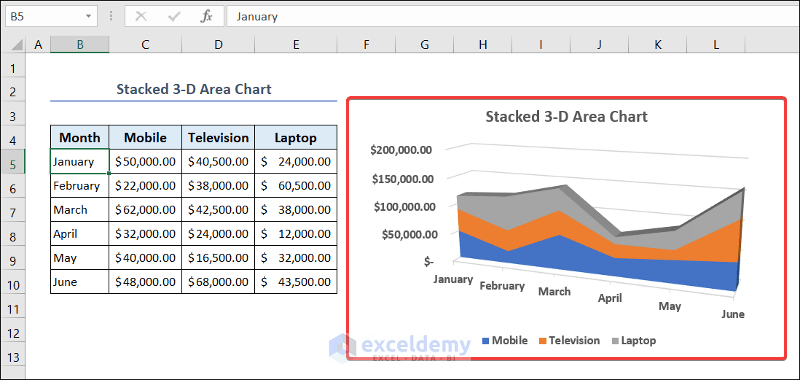
- Select range B4:E10 >> go to the Insert tab >> select Area Chart from the Charts group >> select Stacked 3-D Area Chart.
- You will see the Stacked 3-D Area Chart in your worksheet.
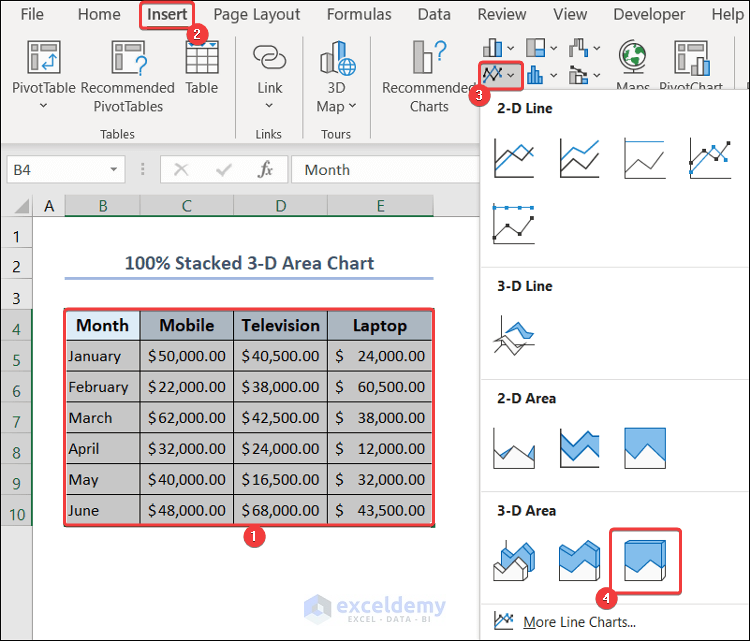
3. 100% Stacked 3-D Area Chart
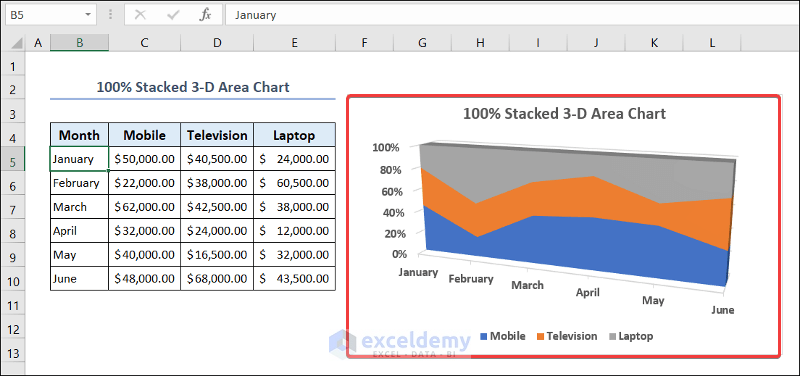
- Select range B4:E10 >> go to the Insert tab >> select Area Chart from the Charts group >> select 100% Stacked 3-D Area Chart.
- You will see the 100% Stacked 3-D Area Chart in your worksheet.
Bring Excel Area Chart to Front
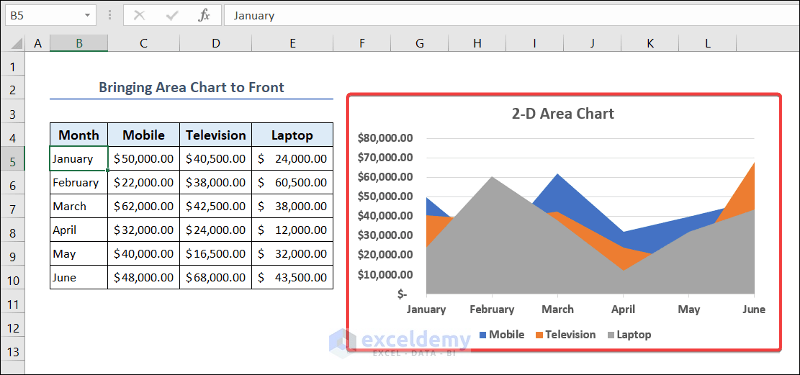
- Create a 2-D Area Chart from the dataset.
- Create a 3-D Area Chart from the dataset.
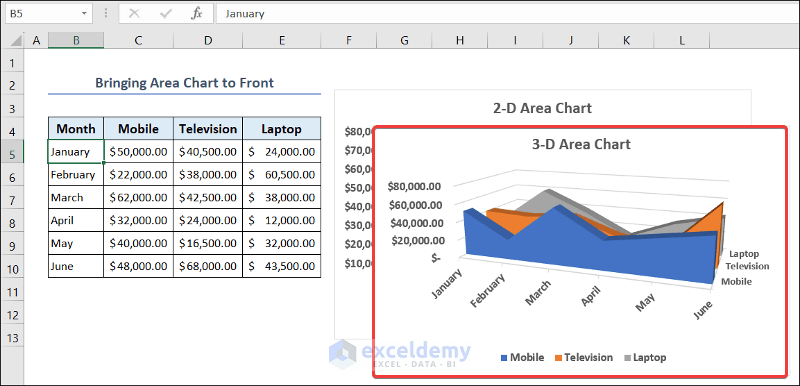
- Now the 2-D Area Chart is below the 3-D Area Chart.
- To bring it at front, right-click on the 2-D area chart >> select Bring to Front.
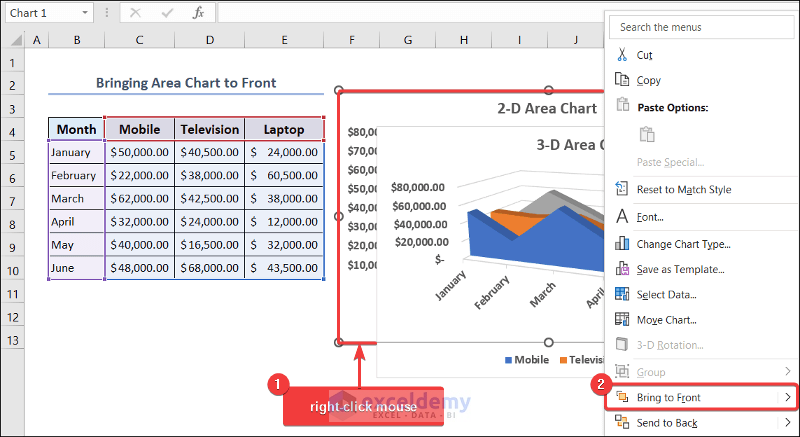
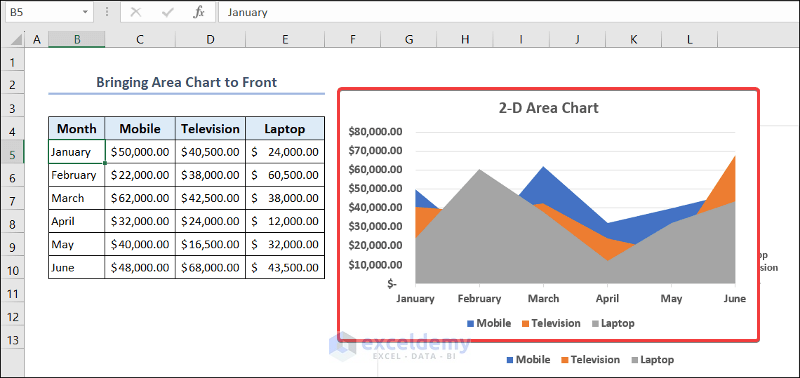
- You will see the 2-D Area Chart at the front of the 3-D Area Chart.
How to Change Order of Area Chart
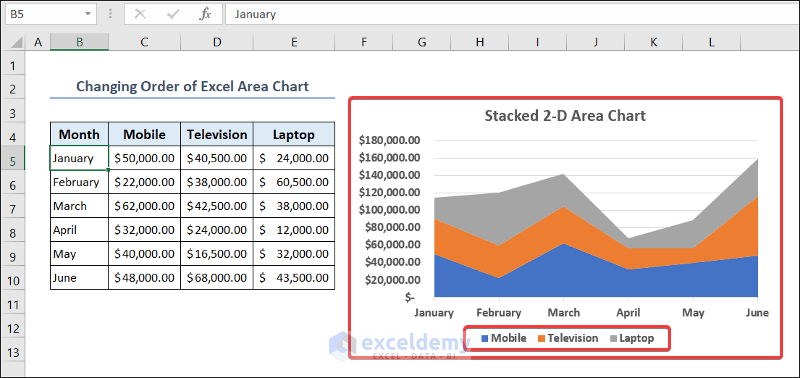
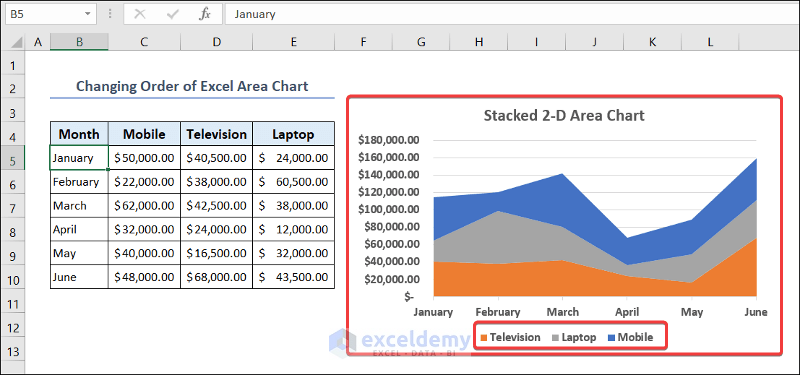
- Create a Stacked 2-D Area Chart.
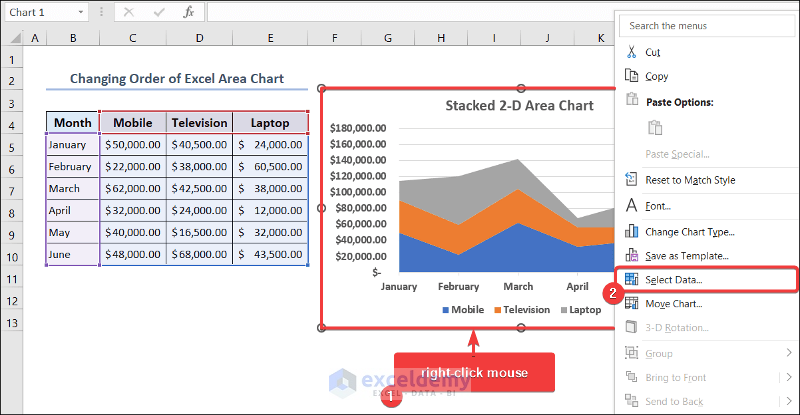
- The order of the chart is Mobile, Television, Laptop. You can customize this order.
- Right-click on the chart >> Select Data.
- In the Select Data Source dialog box, select a Legend Entry >> use the Move Down button to change the order of that entry.
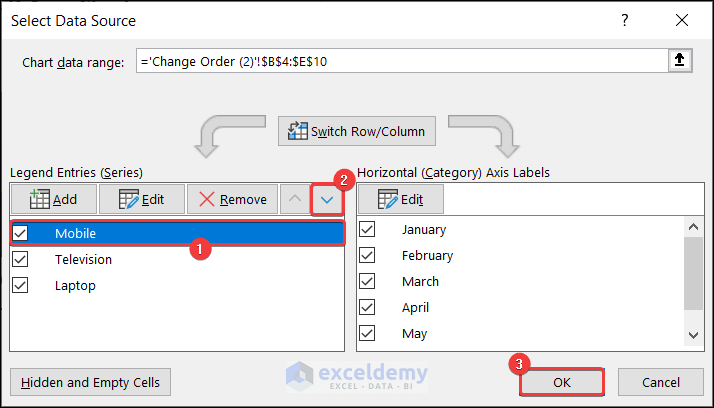
- We have changed the order to Television, Laptop, Mobile.
Read More: How to Change Order of Excel Stacked Area Chart
Make Excel Area Chart Lines Smooth
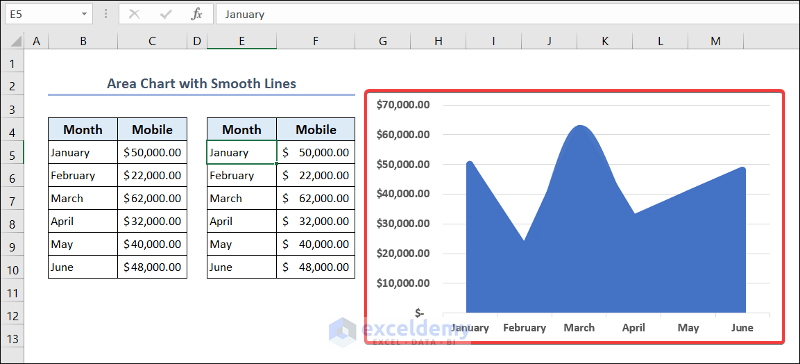
- Make an Area Chart from the dataset of range B4:C10.
- Right-click on the chart >> Select Data.
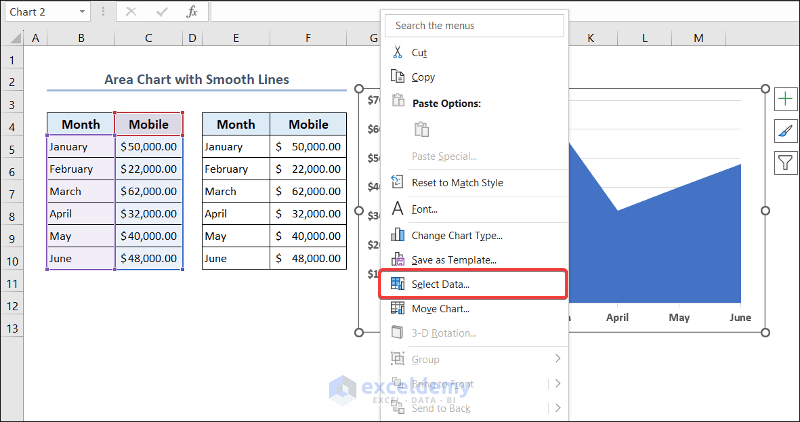
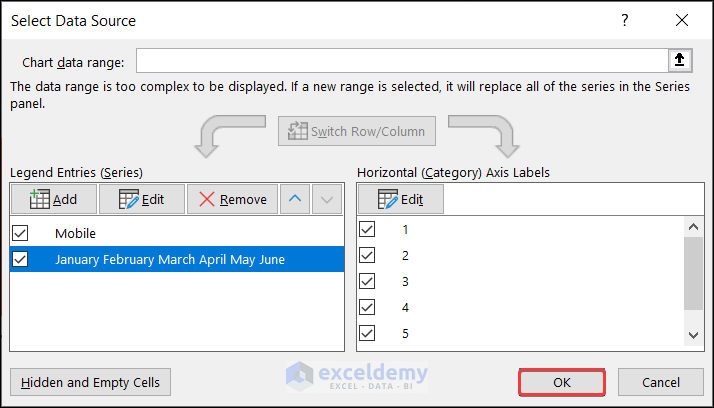
- The Select Data Source dialog box will appear.
- From there, click on Add.
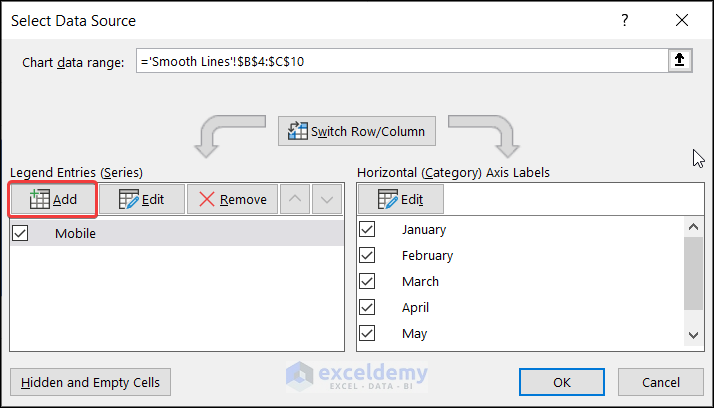
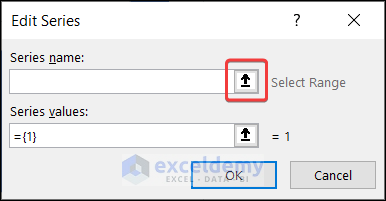
- The Edit Series pop-up will open. Click on the up arrow under the Series name header.
- Select range E5:E10 of the Month column and click on the down arrow.
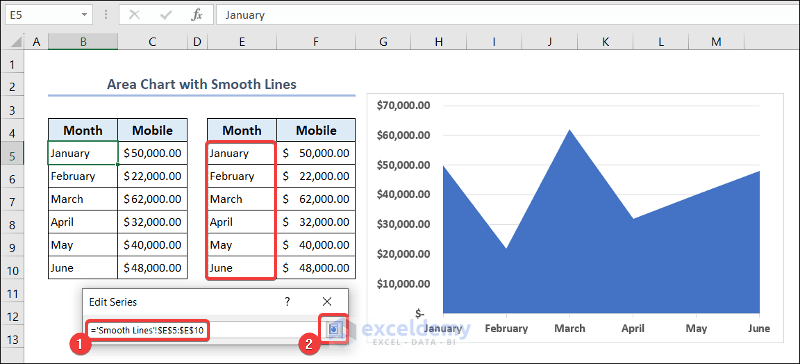
- Click on the up arrow under the Series values header.
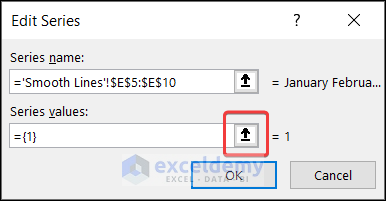
- Select range F5:E10 of the Mobile column and click on the down arrow.
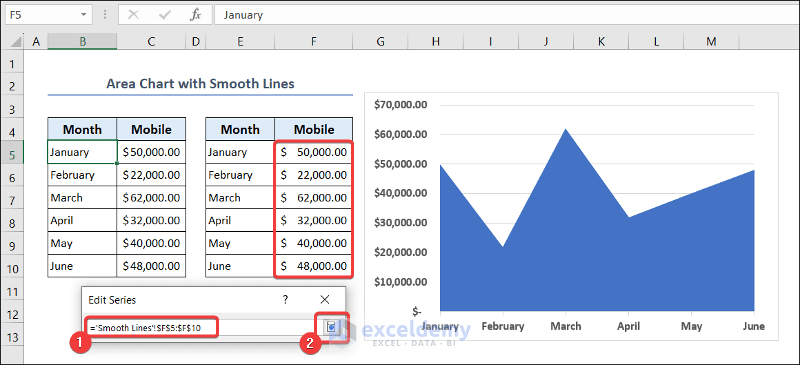
- Press OK in the Edit Series pop-up.

- Press OK in the Select Data Source dialog box.
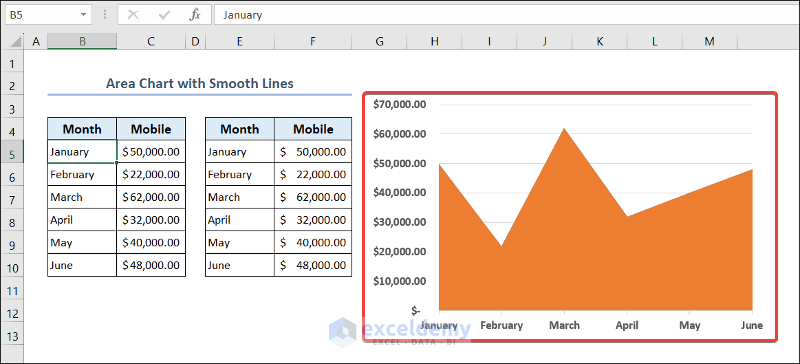
- You will see a new chart added to the old one.
- Now, right-click on the middle of the chart >> select Change Series Chart Type.
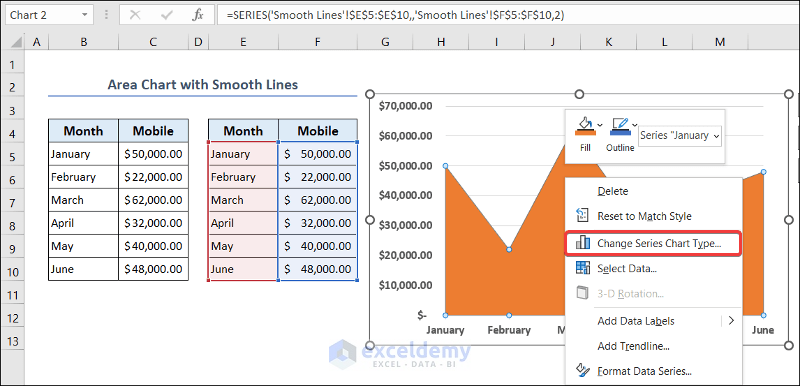
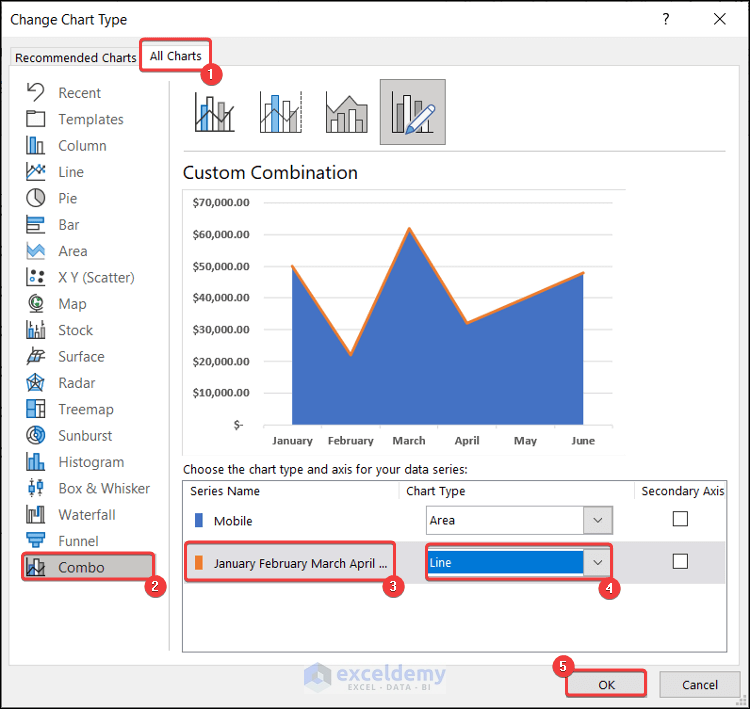
- The Change Chart Type window will appear.
- Go to All Charts >> click on Combo.
- Choose the new chart under the Series Name header.
- Change the Chart Type to Line and press OK.
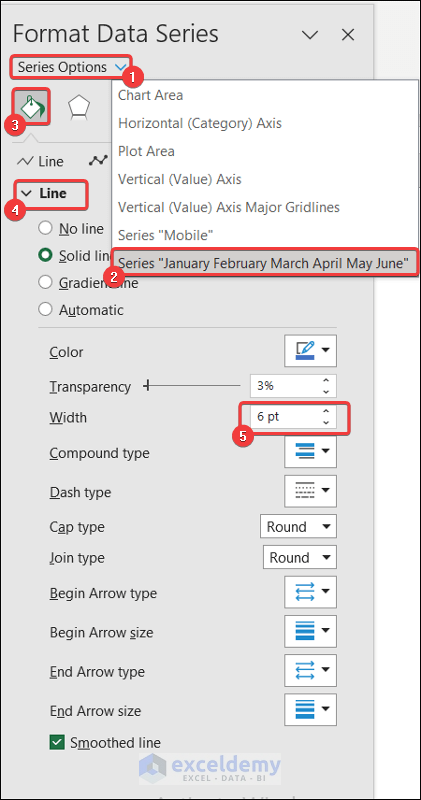
- Now, right-click on the chart and select Format Data Series.
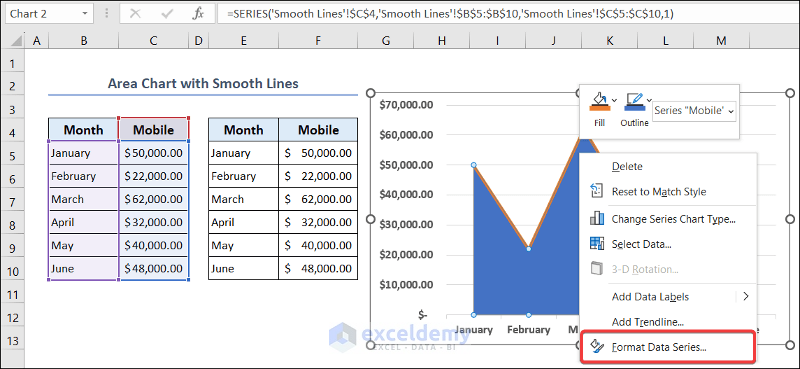
- The Format Data Series window will open on the right side of your worksheet.
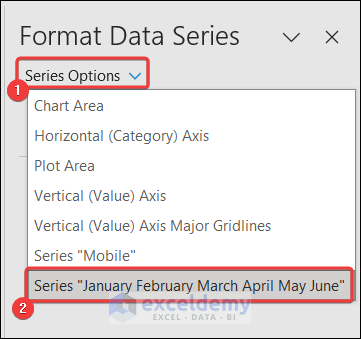
- Click on Series Option >> select the new chart.
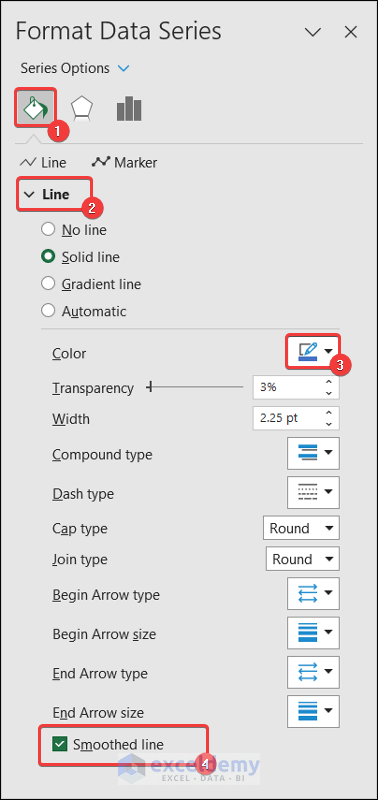
- Select Fill & Line >> click on the Line option.
- Keep the Color the same as the other chart (Blue).
- Check the Smoothed Line option.
- Now, look at the chart. You may see some gaps in between the Line Chart and the Area Chart.
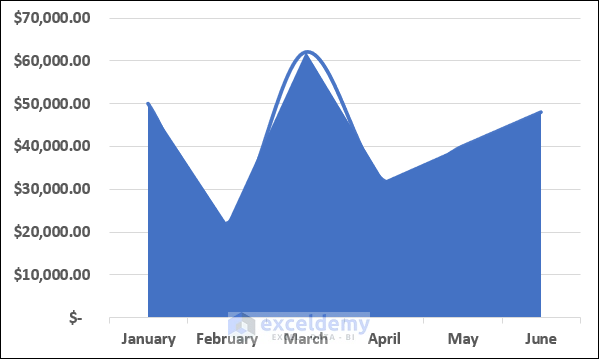
- To get rid of these small gaps, increase the Width of the Line Chart.
- Increase the Width of the Area Chart.

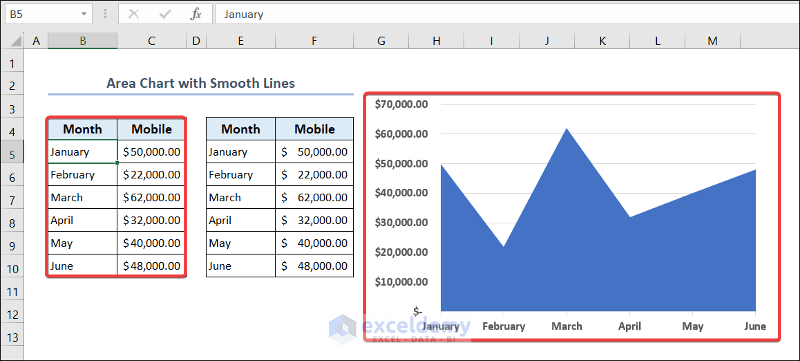
- You will see the Area Chart with smooth lines.
Read More: How to Make Smooth Area Chart in Excel
Pros of Excel Area Chart
- Excel Area Chart is a great way to display trends of products over a specified period of time.
- It gives a clear insight of the pattern followed by each product.
- It is a simple presentation and easy to understand.
- It can handle both positive and negative values.
Cons of Excel Area Chart
- Excel Area Chart may become difficult to analyze if there are a lot of data points.
- It doesn’t normally work well with multiple data series.
- Each line can imply more data than actually available, in comparison to Bar Chart or Column Chart.
Things to Remember
- Users should have a basic understanding of an Area Chart.
- The data should include only a few categories to avoid clutter in the plotted chart.
- One should compare with each other concerning time.
Frequently Asked Questions
1. How many types of Area Charts are there in Excel?
There are three in-built types of Area Charts in Excel:
- Area Chart
- Stacked Area Chart
- 100% Stacked Area Chart
2. Can I use Excel formulas in an Area Chart?
Area Charts mainly rely on numerical data from the worksheet. So, you can use formulas to perform calculations and generate the data that populates Excel Area Charts.
3. Can I combine an Area Chart with other chart types in Excel?
Yes, you can combine an Area Chart with other types of charts in Excel.
Conclusion
In this article, we have presented the process to create an Excel Area Chart. This article aims to enhance users’ efficiency and productivity when it comes to creating and manipulating Excel Area Charts. If you have any questions regarding this essay, don’t hesitate to let us know in the comments. Also, if you want to see more Excel content like this, please visit our website, and unlock a great resource for Excel-related content.
Excel Area Chart: Knowledge Hub
<< Go Back To Excel Charts | Learn Excel

